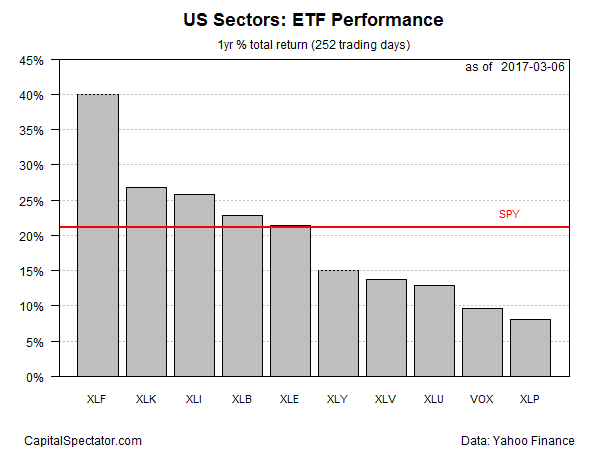
The bullish trend in financial companies remains intact through early March, based on trailing one-year returns via a set of proxy ETFs. Although all ten sectors of the US equity market are posting gains for the 12-month comparison, financial shares enjoy a sizable lead over the rest of the field.
Financial Select Sector SPDR (NYSE:XLF) is up 39.8% over the past year (252 trading days) through March 6. Notably, XLF’s total return is well above the number-two performer for one-year results: Technology Select Sector SPDR (NYSE:XLK), which is ahead by 26.8%.
The prospect of higher interest rates is a key factor in the market’s bullish embrace of financials. “Among S&P 500 industries, banks and diversified financials display the highest positive correlation with both rising rates and inflation,” advises Goldman Sachs strategist David Kostin in a note sent to clients last Friday. “We recommend investors overweight the financials sector based on our expectation that the Fed will hike three times in 2017.”
The market is estimating an 84% probability that the Federal Reserve will lift its target rate at next week’s FOMC meeting, based on Fed funds futures data via CME as of yesterday (March 6).
Although one-year momentum is strongest in financials, all the sectors are trending higher, based on one-year performances. The laggard at the moment: Consumer Staples Select Sector (NYSE:XLP), which is up a comparatively light 8.1% in total-return terms.
The broad equity market, meanwhile, is on a roll. The SPDR S&P 500 (NYSE:SPY) is currently sitting on a strong 21.2% one-year total return through March 7 – a performance that’s comfortably ahead of the bottom-five sector ETF performances for the past year.

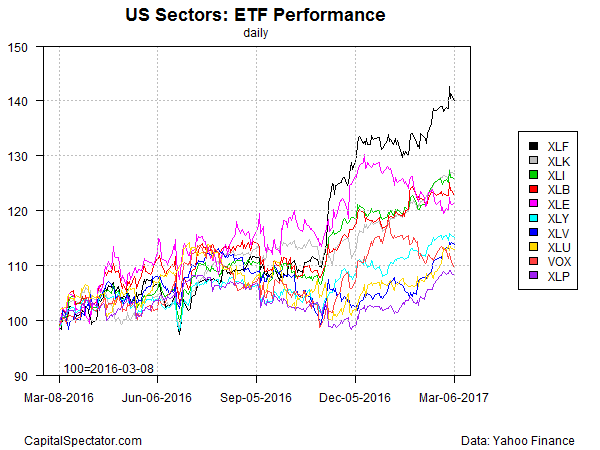
Meanwhile, consider the strong leadership in financials in the performance chart below, which shows rebased prices set to 100 for Mar. 8, 2016. For the one-year window, XLF clearly dominates, as shown by the black line at the top of the chart.

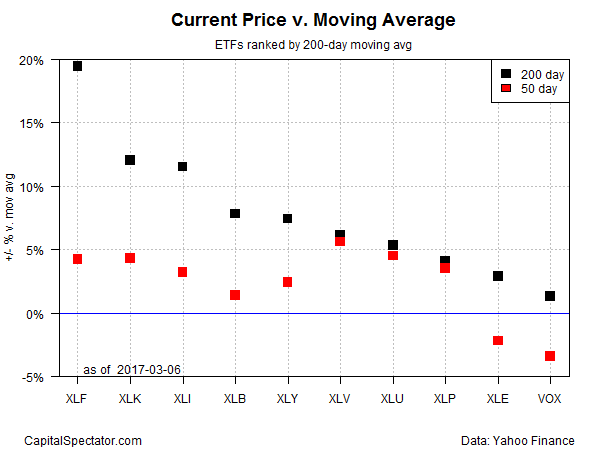
XLF’s supremacy is conspicuous in terms of moving averages too. The ETF is currently trading at close to a 20% premium over its 200-day moving average – substantially more than the comparable price/200-day-average spread in other sector funds.

