This is an excerpt from this week’s digest.
When we feel there’s increased uncertainty in tracking one particular index (in this case the S&P 500 ) we refer to other indices to determine the weight of the evidence. Here we’ll look at the DOW and NYA to see if our preferred POV of the S&P 500 is correct (Micro-3 to top in the SPX2373-2366 zone; to be followed by Micro-4).
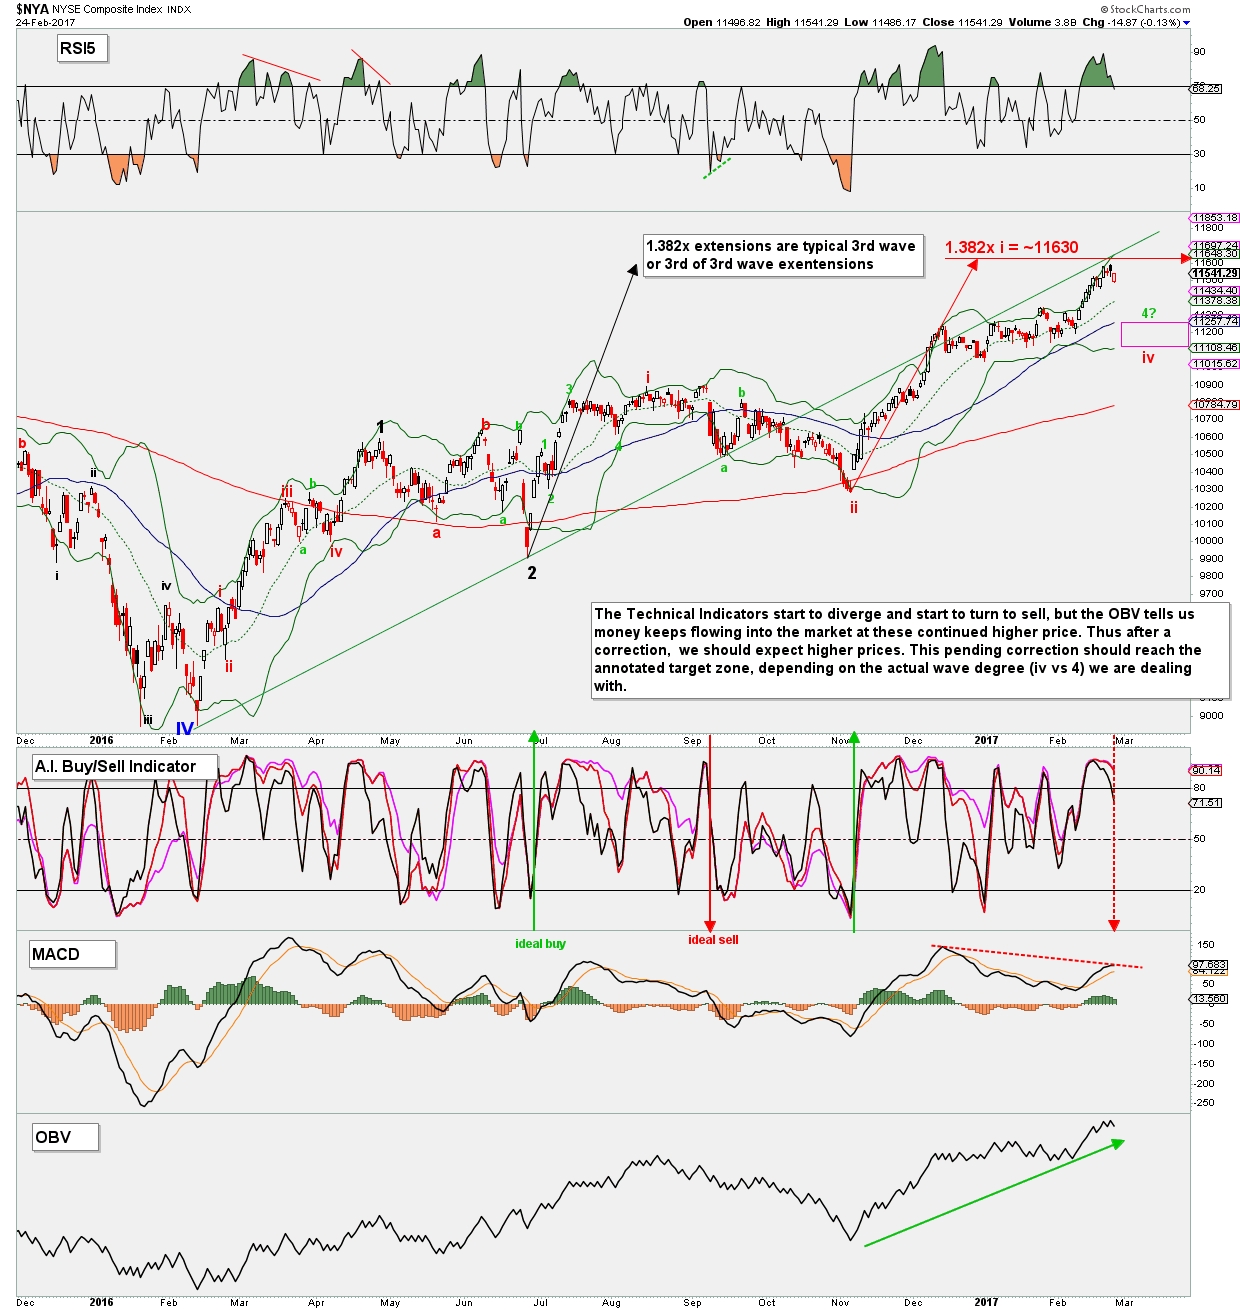
Here only the NYA analyses is shown.

The most striking observation on this chart is that price is getting very close to the 1.382x extension of (red) intermediate-i measured from intermediate-ii. As indicated on the chart; this Fib-extension is typical for either all of a 3rdwave extension or “only” the 3rd of a 3rd wave extension. The latter would support our POV of the S&P 500 , but we’ll let the market decide which it will be eventually. In addition, the 1.00x extension of major 1, measured from 2, (black arrow) also resides right around this 1.382x extension: one degree lower 3rd waves (iii vs 3) often tag that extension (or the 1.236x extension).
In the first case (red) intermediate iv should then retrace, ideally, up to 38.2% of all of int.-iii (~$11,800); and in the case of a minor 3 top (green) minor 4 should then retrace, ideally, up to the 38.2% of all of minor-3 (~$11,250). A marginal higher high to ~$11,630 would set up negative divergence on the daily RSI5, and firm up the negative divergence on the daily MACD. Note that the On-Balance-Volume indicator is not diverging yet, telling us money keeps pouring into the market and we should expect higher prices after the correction.
This chart also supports our preferred POV of the S&P 500 ; where we expect an interim top around SPX2375.
