Ralph Elliott referred to three important aspects of price movement in his theory: pattern, ratio, and time. His analysis of mathematical properties of waves and patterns eventually led him to conclude that “The Fibonacci Summation Series is the basis of The Wave Principal”. Numbers from the Fibonacci sequence surface repeatedly in Elliott wave structures.
While using Elliott Wave Analysis to assess opportunities, we look for consistent adherence to the chart pattern that is simultaneous to price reacting at key Fibonacci levels of support and resistance. Over time, solid adherence to these levels provides high confidence, low risk to reward entries into positions for investors. When it comes to high confidence, FedEx Corporation (NYSE:FDX) is as pretty as it gets, and is one we are monitoring for our subscribers to gain an attractive entry in the coming 30-days.
In my recent article “Buy in May and Go Away – S&P 500 Targets and Timing” I point out the S&P 500 is setting up for a final drop to complete its Miner degree wave 4 into the 2,480-2,490 region, or possibly a larger triangle or running flat that finds support in the 2,552 area, and that investors should prepare their wish list of individual stocks they want to own now, in order to be prepared when the flush comes. While putting together your list, be sure to ad FDX, as it’s a picture perfect match to our S&P 500 price perspective.
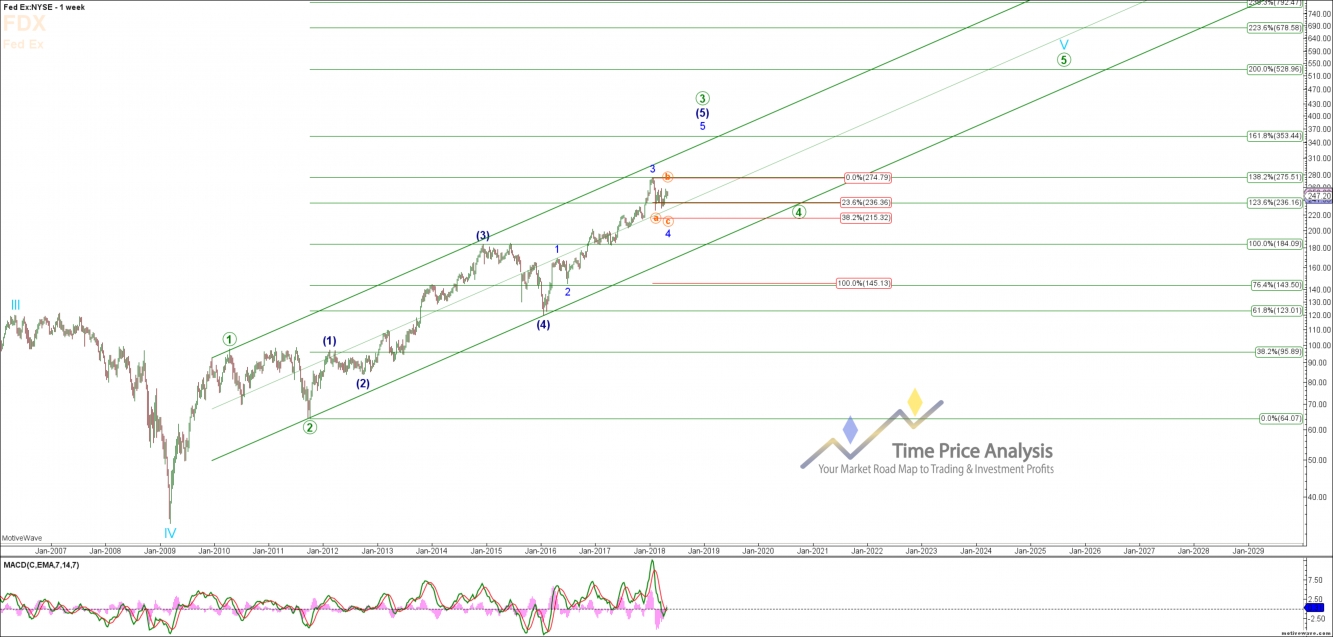
In simple terms, we are looking for an entry into FDX in the $215 - $221 region for a move up to $353 during the Miner degree wave 5. That’s 64% of upside during a period we expect a 28% increase in the S&P 500, and one we expect will take no more than 6 – 12 months to realize as both FDX and the S&P conclude their Intermediate Degree wave (3).
Now, let’s take a look at why FedEx Corp is such a good setup, by referring to the weekly chart. Off the 2009 low, in textbook fashion wave (1) of the Intermediate Degree has hit the .382 extension, then the (3) hit the 1.0 extension, and wave 3 of Miner Degree hit the 1.382. In the use of Fibonacci extensions, these are what we would refer to as “perfect hits”. Over time - as the chart pattern and Fibonacci extensions adhere - we gain greater confidence. What most commonly follows next is a .382 retracement of Miner Degree wave 3, where in the case of FDX, would beget a price movement to the $215 region, followed by a move to $353, at the 1.618 extension to complete Miner Degree wave 5.
So, in conclusion, we will be closely monitoring FedEx Corp for our subscribers, and looking for an entry that allows a tight risk to reward, with an expectation of a move higher that will outperform the S&P by more than double the percentage return.
Stay tuned for more!

