As the stock market hits all-time highs in its 2nd longest bull market run in history, the lift of asset prices has surely lifted the economic prosperity of all. Right?
Not really.
New reports from the Hamilton Project and The Federal Reserve show the real problems facing Americans today.
First, the Hamilton Project as noted by Pedro Nicolaci Da Costa last week:
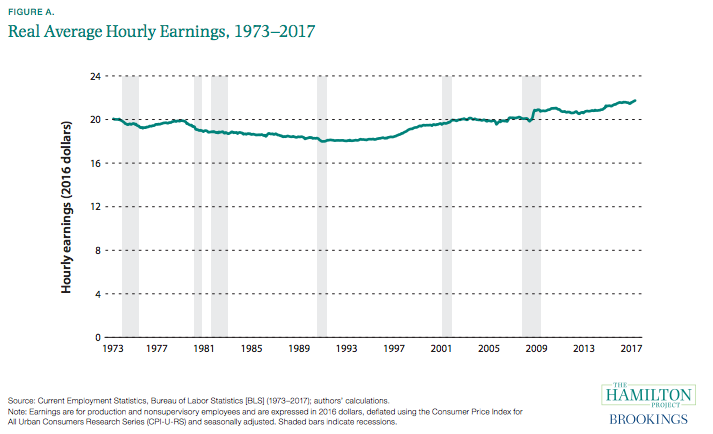
“An expansion that began, believe it or not, more than seven years ago has extended a longer-run trend of wage stagnation for the average US worker, despite a sharp drop in the official unemployment rate to 4.4% from an October 2009 peak of 10%.
No wonder the recovery seems so lopsided, particularly given economic inequality levels not seen since before the Great Depression. After adjusting for inflation, wages are just 10% higher in 2017 than they were in 1973, amounting to real annual wage growth of just below 0.2% a year, the report says. That’s basically nothing, as the chart below indicates.”
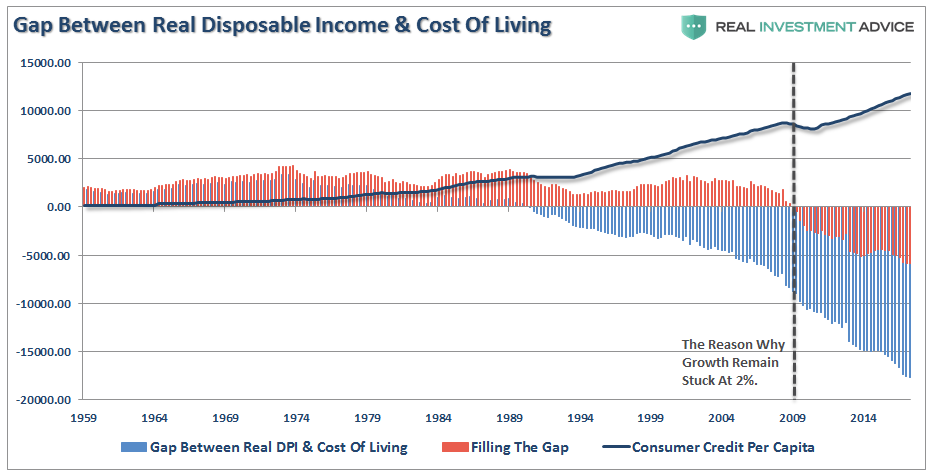
The problem with this, of course, is that if wages aren’t rising at a pace fast enough to offset the costs of maintaining the “standard of living,” individuals are forced to turn to credit to fill the gap. As I showed recently, this wasn’t a problem initially but now is THE problem for an economy that is roughly 70% driven by personal consumption.
“Therefore, as the gap between the “desired” living standard and disposable income expanded it led to a decrease in the personal savings rates and increase in leverage. It is a simple function of math. But the following chart shows why this has likely come to the inevitable conclusion, and why tax cuts and reforms are unlikely to spur higher rates of economic growth.”
The Federal Reserve Reveals The Ugly Truth
Every three years the Federal Reserve releases a survey of consumer finances that is a stockpile of data on everything from household net worth to incomes. The 2016 survey confirms statements I have made previously regarding the Fed’s monetary interventions leaving the majority of Americans behind:
“However, setting aside that point for the moment, how valid is the argument the rise of asset prices is related to economic strength. Since companies ultimately derive their revenue from consumers buying their goods, products, and services, it is logical that throughout history stock price appreciation, over the long-term, has roughly equated to economic growth. However, unlike economic growth, asset prices are psychologically driven which leads to “boom and busts” over time. Looking at the current economic backdrop as compared to asset prices we find a very large disconnect.
Since Jan 1st of 2009, through the end of June, the stock market has risen by an astounding 130.51%. However, if we measure from the March 9, 2009 lows, the percentage gain explodes to more than 200%. With such a large gain in the financial markets we should see a commensurate indication of economic growth – right?”
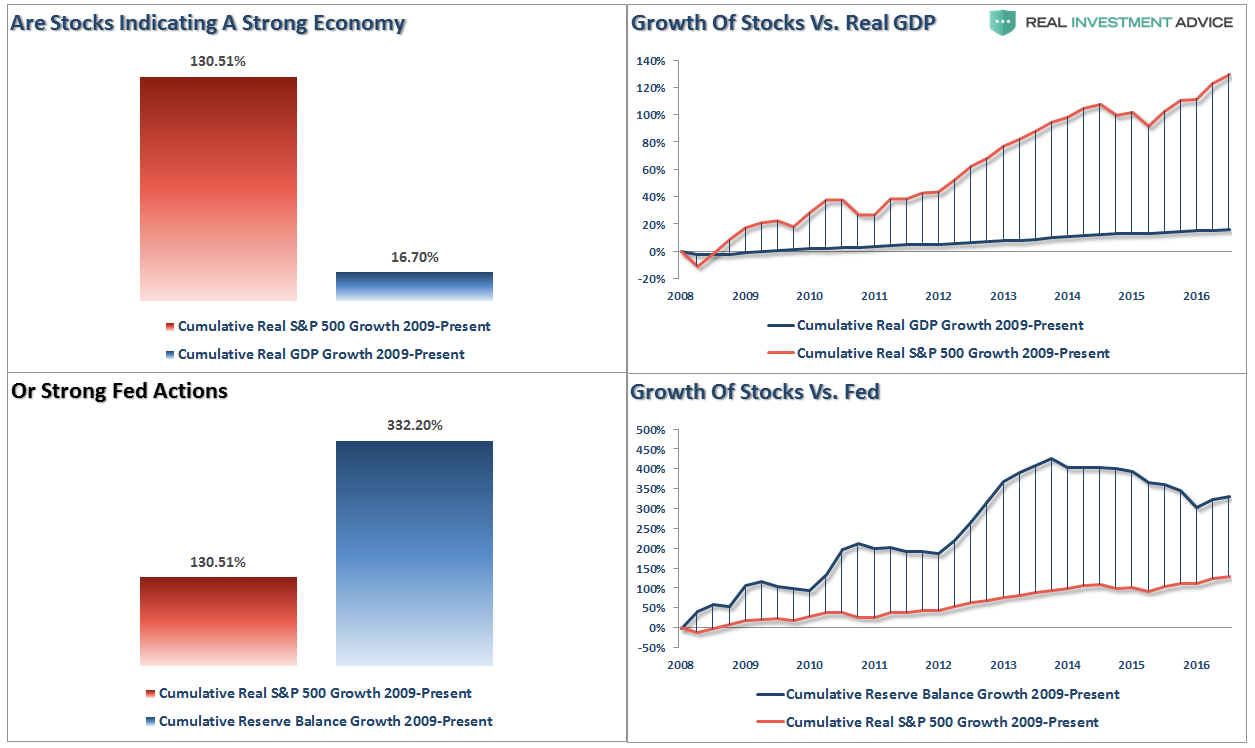
“The reality is that after 3-massive Federal Reserve driven “Quantitative Easing” programs, a maturity extension program, bailouts of TARP, TGLP, TGLF, etc., HAMP, HARP, direct bailouts of Bear Stearns, AIG, GM, bank supports, etc., all of which total more than $33 Trillion, the economy grew by just $2.64 Trillion, or a whopping 16.7% since the beginning of 2009. The ROI equates to $12.50 of interventions for every $1 of economic growth.”
The full Federal Reserve report can be found here, but I have selected a few of the more important charts for the purpose of this post.
While the mainstream media continues to tout that the economy is on the mend, real (inflation-adjusted) median net worth suggests that this is not the case overall. Despite surging asset prices, household net worth has only recovered back to 1995 levels.
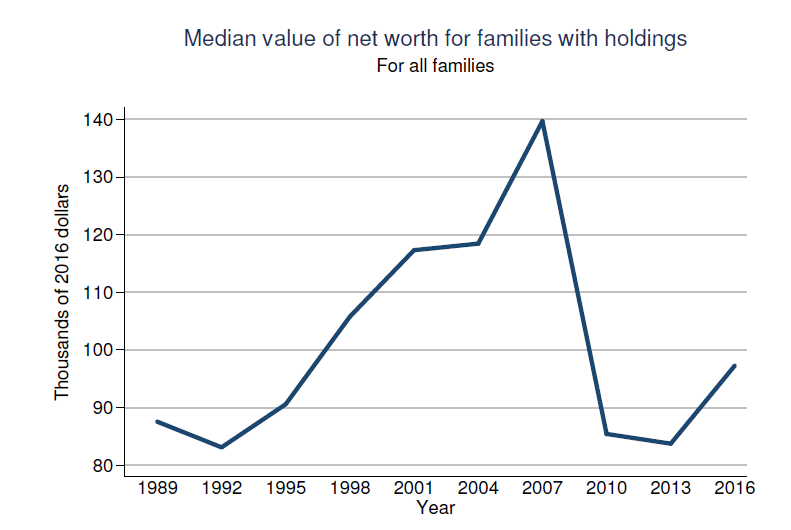
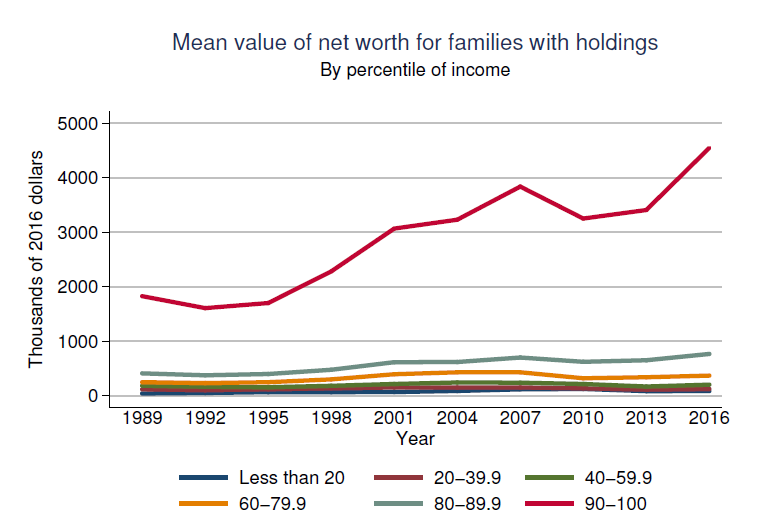
But even that view is highly optimistic as the recovery in net worth has been heavily skewed to the top 10% of income earners.
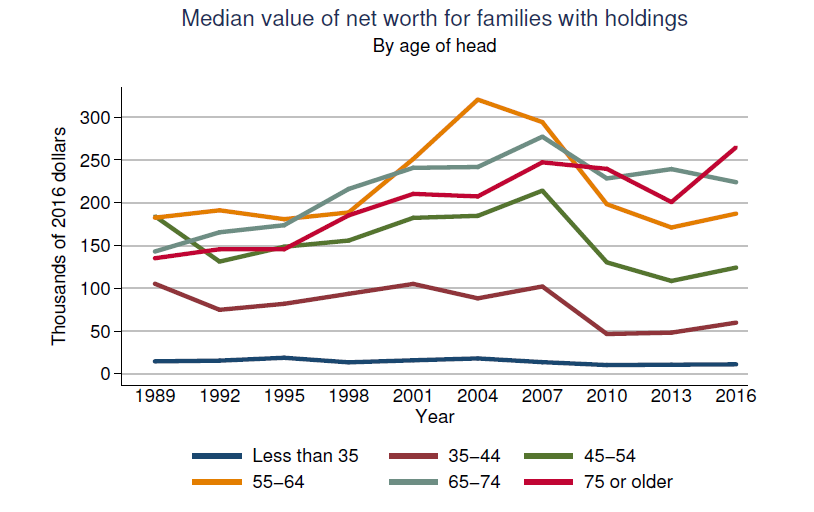
While many economists have tried to explain the plunging labor force participation rate (LFPR) was a function of“baby boomers” entering into retirement, such is hardly the case given the collapse in net worth of those in that age group. It’s not that they don’t want to retire, they simply can’t afford to.
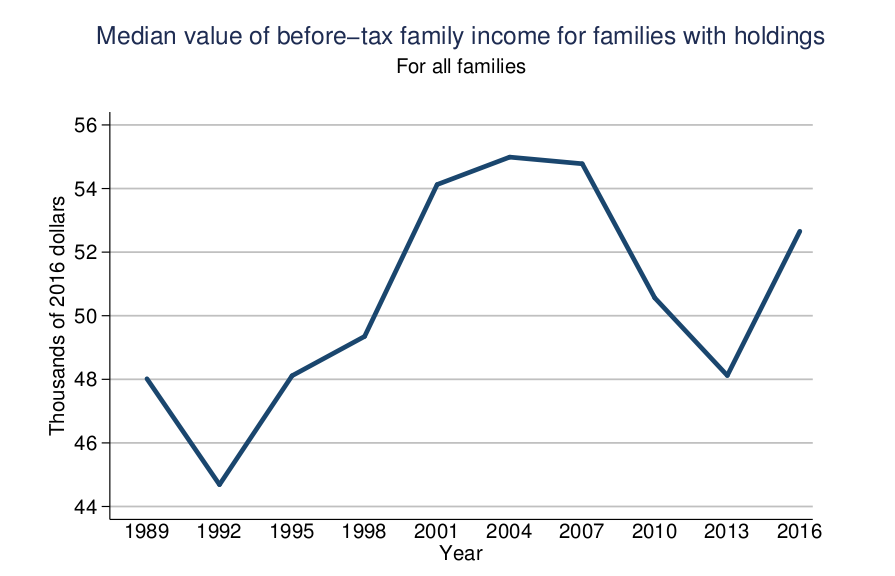
The “economic recovery” story is also extremely fragmented when looking at median incomes. According to the Fed survey, median household before-tax incomes have fallen from near $55,000 annually to roughly $53,000 currently.
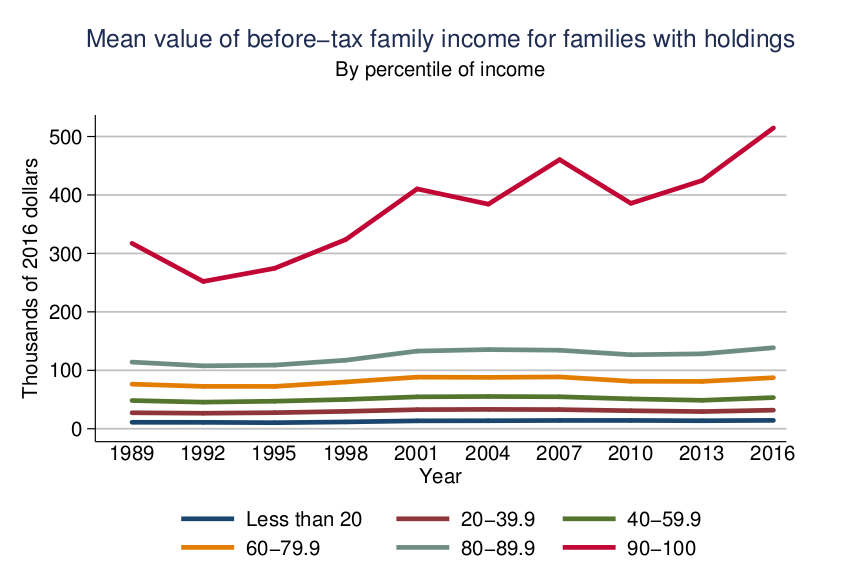
Again, the real story becomes much more apparent when incomes are broken down into deciles.
Interestingly, the ONLY TWO age-groups where incomes have improved since 2007 is for those two groups of 65 and older. Again, this suggests that the plunge in the LFPR is not a function of “retirement” as individuals are working well into their retirement years, not because of a desire to work, but due to necessity.
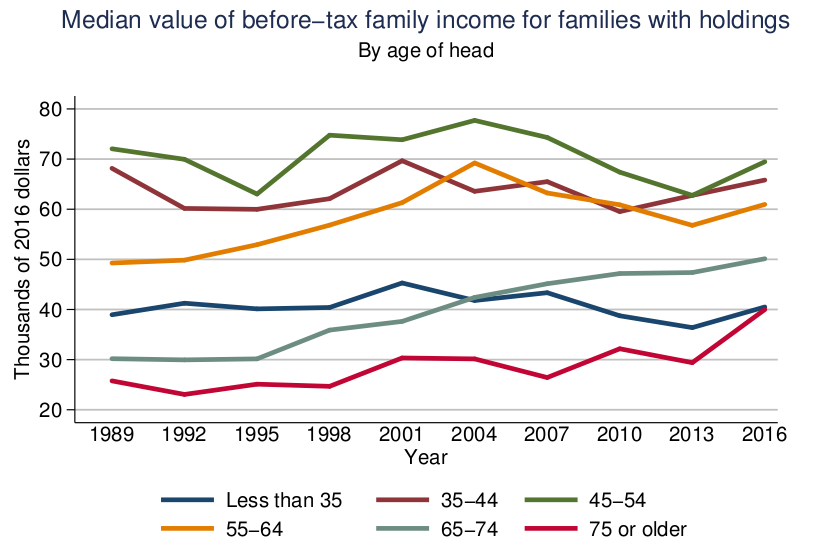
Despite the mainstream media’s rhetoric the surging stock market, driven by the Federal Reserve’s monetary interventions, has provided a boost to the overall economy. The reality is quite different.
Since the bulk of the population either does not, or only marginally, participates in the financial markets, the “boost” has remained concentrated in the upper 10%. The Federal Reserve study breaks the data down in several ways, but the story remains the same.
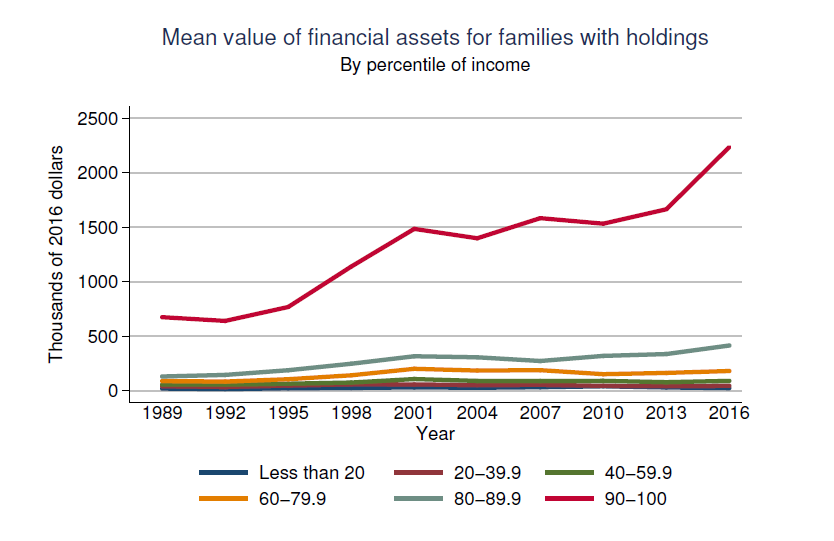
The median value of financial assets for families has fallen sharply since the turn of the century.
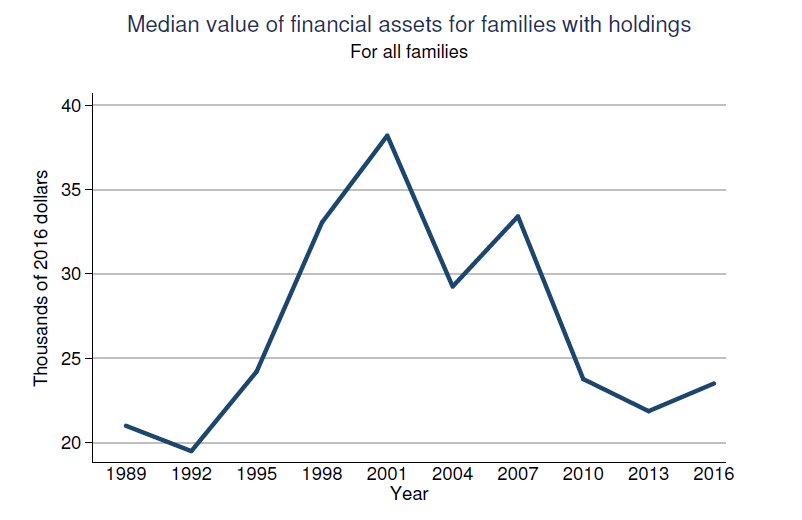
Except for those in the top 10 percent of the population.
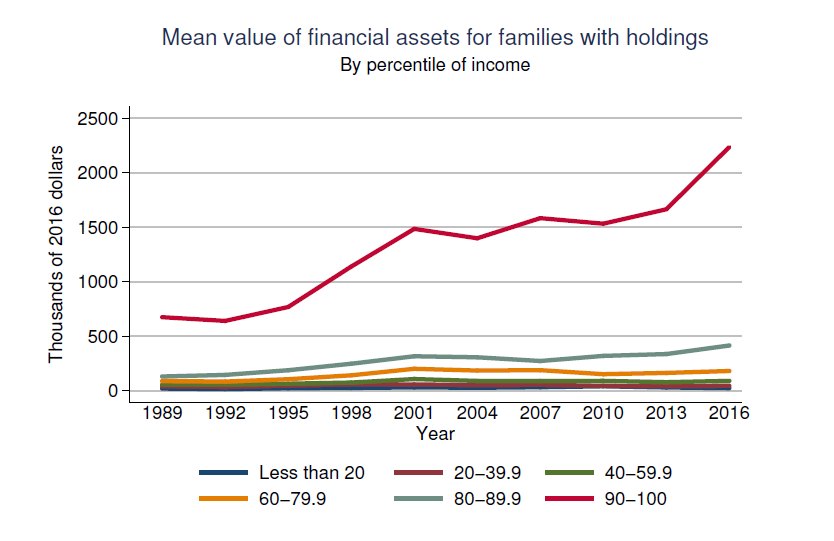
While the Federal Reserve hoped that inflating asset prices would boost consumer confidence, consumption, and economic growth, the problem is that with falling incomes and rising costs of living, the ability to save and invest eluded the majority of families.
Again, the benefit of the Federal Reserve’s interventions was clearly concentrated in the top 10%.
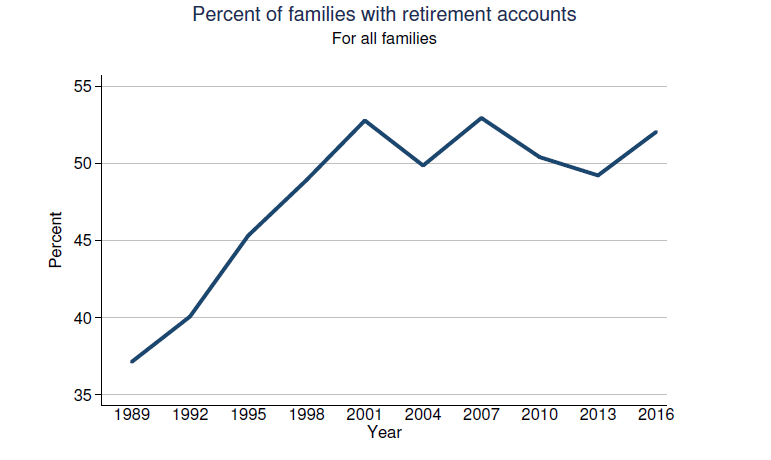
When looking at the financial landscape of families, the future does not look bright. The percentage of families with retirement accounts is at the same level as it was in 2000, despite surging asset prices. Again, this is a function of the disparity between incomes and the cost of living.
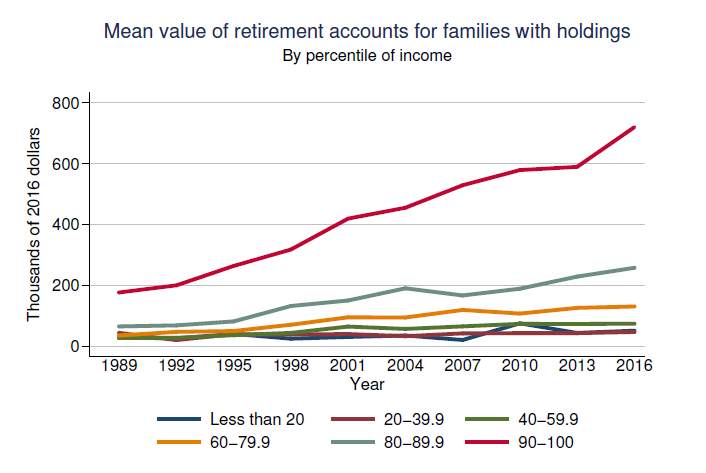
But once again, for the top 10%, the last five years has been a windfall. However, it is interesting to note that values dropped in 2013 despite the surge in asset prices. The 80th percentile performed better.
Lastly, as discussed recently, there is a deep flaw in the Bureau Of Labor Statistics adjustments to the employment report and little evidence to support the “birth/death” model which has accounted for roughly all of the job growth since 2009. The assumption is that each month individuals are either starting or closing a business that is not reflected in the more normalized employment data. The problem, however, is that the number of families that owned business equity has been on the decline since 1992.
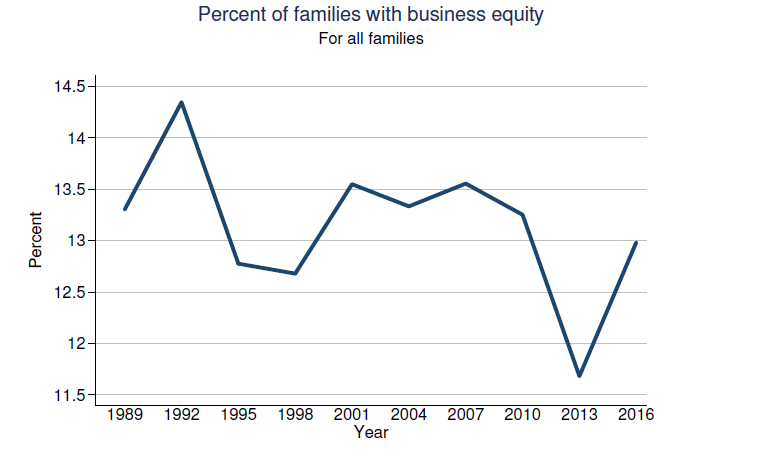
Well, except for those in the top 10%.
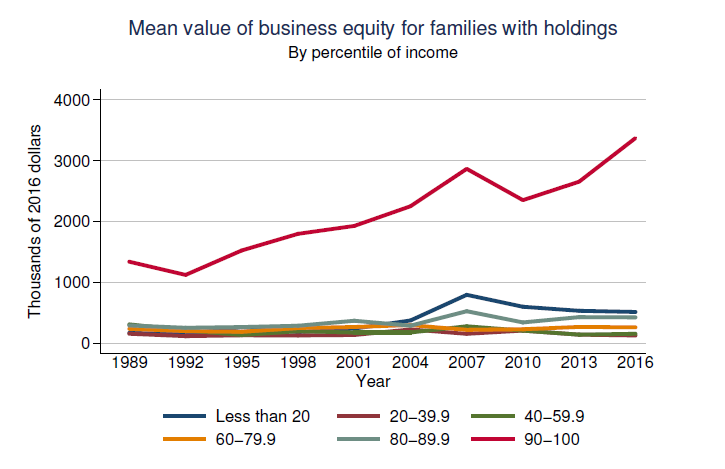
The lack of economic improvement is clearly evident across all data points. However, it has been the very policies of the current and past administrations that have fostered that wealth divide more than anything else. While the ongoing interventions by the Federal Reserve propelled asset prices higher, and fueled the demand for risks, the majority of American families were left behind.
Tax Cuts Won’t Work This Time
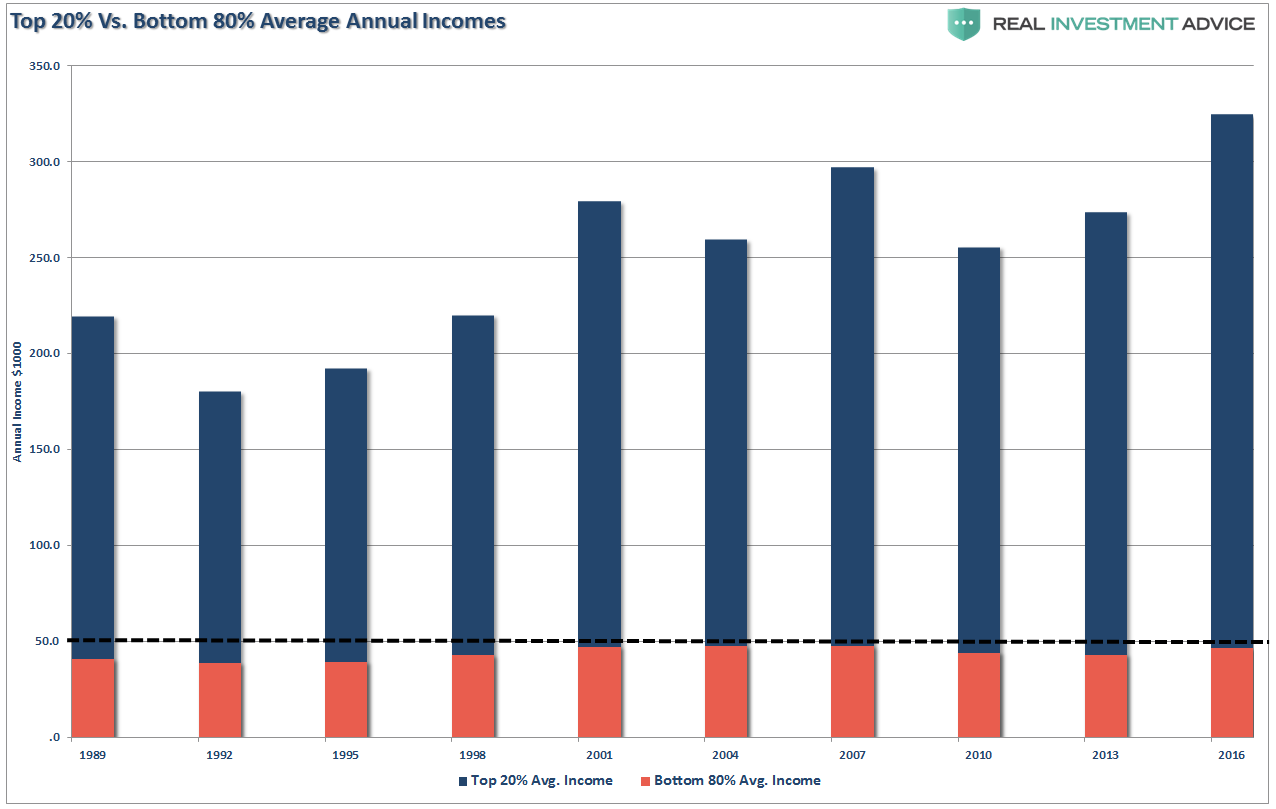
This is also why Trump’s recent tax cut policy will fail to fuel the economic prosperity he is hoping for. With the bottom 80% of the population still earning below $50,000 on average, a tax cut will do little to increase their consumption in the economy. Those in the top 20% may well see a tax-savings from the reform but they are already consuming at a level that will likely not change to any great degree.
As David Stockman pointed out this past week:
“The Donald’s new tax reform airball promises to make the filing with the IRS more palatable to rank and file America. Yet 101 million taxpayers (69%) have no exposure to the complexity of the IRS code at all. They owe virtually nothing.
And I mean nothing. Among the 148 million income tax filers, the bottom 53 million owed zero taxes in the most recent year (2014), and the bottom half (74 million) paid an aggregate total of just $45 billion.
By contrast, the top 4% or 6.2 million filers paid $802 billion in Federal income taxes. That amounted to nearly 58% of total Federal income tax payments.”
While the financial media incessantly drones on about the rise of the stock market, what is missed is that after two devastating bear markets many families no longer have the capacity to participate (particularly after following Wall Street advice).
Furthermore, the structural transformation that has occurred in recent years has likely permanently changed the financial underpinnings of the economy as a whole. This would suggest that the current state of slow economic growth is likely to be with us for far longer than most anticipate. It also puts into question just how much room the Fed has to extract its monetary support before the cracks in the economic foundation begin to widen.
“The chickens have likely come home to roost.”
