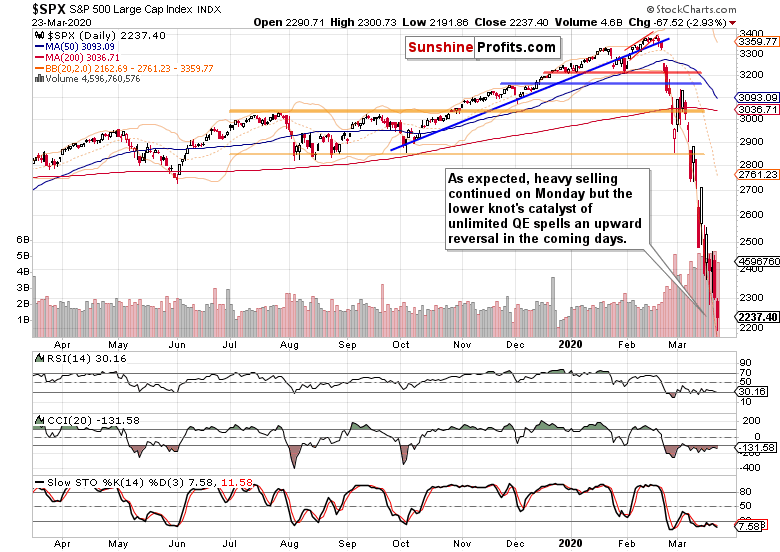
On the heels of the Fed’s unlimited QE promise, the S&P 500 sprang to life finally. All the gains though were given up in less than three hours.
Let’s start our analysis with the daily chart examination (chart courtesy of http://stockcharts.com).
Opening with a bearish gap, stocks continued with their slide as can be seen in both the S&P 500 Index and the popular SPY (NYSE:SPY) ETF.
Yet, the Fed stepped in again, pledging unlimited QE. Stocks rallied as a result, but gave up all of their gains before too long.
In the overnight session, the futures made it to over 2333. Now, that’s an example of some bullish action in the short-term.
Let’s remember yesterday’s notes regarding the market breadth indicators:
(…) While they all confirm the bears as being in the driving seat, new highs minus new lows reveal that the sellers aren’t as strong as they appear to be when one looks at price action only. The bullish percent index has also curled higher despite new 2020 lows being hit. As a result, the market breadth indicators show a high likelihood of pause in the trend of continuously lower prices. Be it in the form of a sharp rally that runs out of steam relatively fast, or a somewhat more prolonged sideways trading with a bullish bias, it nonetheless justifies our decision earlier today to take the 168-point profit on our short positions off the table.
These observations turned out as expected. The summary below captures the short-term outlook accompanied by the trading plan.
Summing up, while the bears have the upper hand, the potential for a temporary upswing hasn’t decreased despite Friday’s slide. And this Fed move might surely stick for longer. The only practical question is whether the rate of new money creation will be faster than the rate of wealth destruction. As the markets like this move, it makes sense to give it the benefit of (short-term and conservative) doubt.
