• Fed Chair Yellen: December rate hike a “live possibility” Fed Chair Janet Yellen said in her testimony before the House Financial Service Committee that if the upcoming US data support further improvement in the labor market and the return of inflation to the 2% target, the December rate hike would be a live possibility. Even though the tone of the speech was similar to the FOMC October meeting statement, this was Yellen’s first direct communication with the market. The fact that she supported the case of a liftoff bolstered expectations for higher interest rates and strengthened the greenback across the board. Investors raised their expectations of a December rate hike to around 60% from near 35% before the October FOMC meeting. In addition to Chair Yellen, New York Fed President William Dudley said later on Wednesday that he would "completely agree" with Yellen that December "is a live possibility”, but the decision will depend on the data.
• We maintain our focus on the October employment report, the minutes of the FOMC October meeting and on any Fed speakers going into the December meeting for more insights about officials’ view over the outlook of the US economy. It has become very clear that the decision on whether to start normalization this year is data-driven. Therefore, positive US data surprises are now required for the market to re-price expectations and USD to gain further.
• The highlight of the day will be the Bank of England monetary policy meeting. This is the second “Super Thursday” as the Bank simultaneously releases its meeting decision, the meeting minutes and the quarterly Inflation Report. The consensus is that the vote will once again be split 8-1 with Ian McCafferty to maintain his call for a rate rise. Market participants will be eager to see if McCafferty is joined by the formerly hawkish Martin Weale or Kristin Forbes, who argued that the underlying inflation should start to pick up soon and that monetary policy would need to be tightened sooner. In the Inflation Report, Bank officials could lower their near-term GDP growth and CPI forecasts given the lower than expected preliminary GDP for Q3 and near zero inflation for most of this year. As a result, the impact on GBP will highly depend on the extent of the revision and on the tone of the meeting minutes.
• Besides the BoE, the Norges Bank decides on its interest rates as well. Norway’s neighbors are once again in an easing mood, putting pressure on Norges Bank to follow suit. However, since the September rate cut was justified as a precautionary move, we believe that the Bank will refrain from acting now as it seems to be one step ahead. What is more, NOK has declined more than the Bank forecasted in September, which supports our view for no action at this meeting.
• As for the indicators, Germany’s factory orders fell unexpectedly in September, extending the previous month’s shrinkage. The forecast was for a 1.0% mom increase, a turnaround from -1.8% mom in August. The drop in September highlighted increasing risks of a slowdown in Eurozone’s largest economy, and weighed on the common currency. Eurozone’s retail sales, a closely watched measure of household confidence, are expected to have increased modestly in September. However, Germany’s sales stagnated in the same month, providing evidence that consumer sentiment in the bloc’s top economy is starting to wane. This increases the possibilities for a disappointment in the Eurozone figure as well. Sweden’s industrial production for September is also to be released.
• In the US, initial jobless claims for the week ended on Oct. 26 are expected to come at 262k from 260k the previous week. This would leave the 4-wk moving average unchanged at 259k. The preliminary Unit Labour Costs Index for Q3 is coming out as well and expectations are for the index to have risen after falling the previous quarter. Usually the market pays little attention to this indicator, but we will watch it closely due to the Fed’s emphasis on the employment data moving into the December FOMC meeting, and especially one day ahead of the US employment report.
• As for the speakers, besides BoE Governor Carney press conference, ECB President Mario Draghi gives another speech, while Fed Vice-Chair Stanley Fischer and New York Fed President William Dudley speak at a workshop. Philadelphia Fed President Patrick Harker, Chicago Fed President Charles Evans, Atlanta Fed President Dennis Lockhart, and Fed Board Governor Daniel Tarullo also speak. Fed speakers have to continue to communicate that they are likely to raise rates to avoid surprising the markets.
The Market
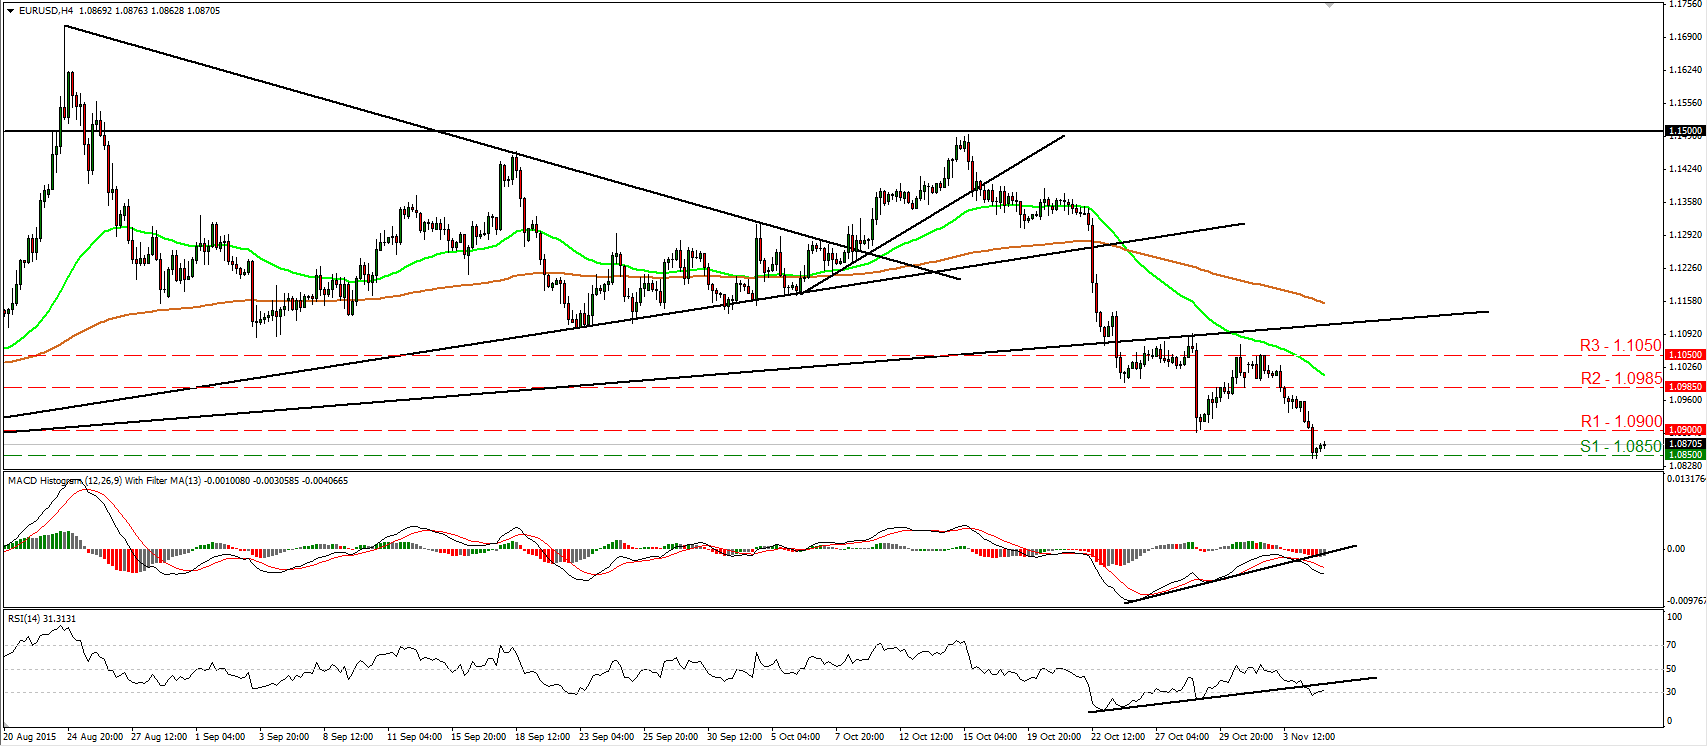
EUR/USD breaks below 1.0900 and hits 1.0850
• EUR/USD continued its slide on Wednesday and managed to break below the support (now turned into resistance) zone of 1.0900 (R1), defined by the low of the 28th of October. The decline was stopped fractionally below our next hurdle of 1.0850 (S1) and then the rate rebounded somewhat. On the 4-hour chart, the short-term picture still looks negative and as a result, I would expect a clear break below the 1.0850 (S1) barrier to set the stage for extensions towards the key support territory of 1.0800 (S2). Both our short-term oscillators, already within their bearish fields, fell below their upside support lines, supporting the negative near-term outlook. However the RSI hit support at its 30 line and turned up, giving evidence that the corrective bounce may continue for a while before sellers decide to shoot again. Perhaps to challenge the 1.0900 (R1) line as a resistance this time. In the bigger picture, as long as EUR/USD is trading between the 1.0800 key support and the psychological zone of 1.1500, I would maintain my neutral stance as far as the overall picture is concerned. The short-term downtrend could be headed towards the lower bound of the range, but I would like to see a clear break below the 1.0800 hurdle before assuming that the longer-term trend is back to the downside.
• Support: 1.0850 (S1), 1.0800 (S2), 1.0700 (S3)
• Resistance: 1.0900 (R1), 1.0985 (R2), 1.1050 (R3)
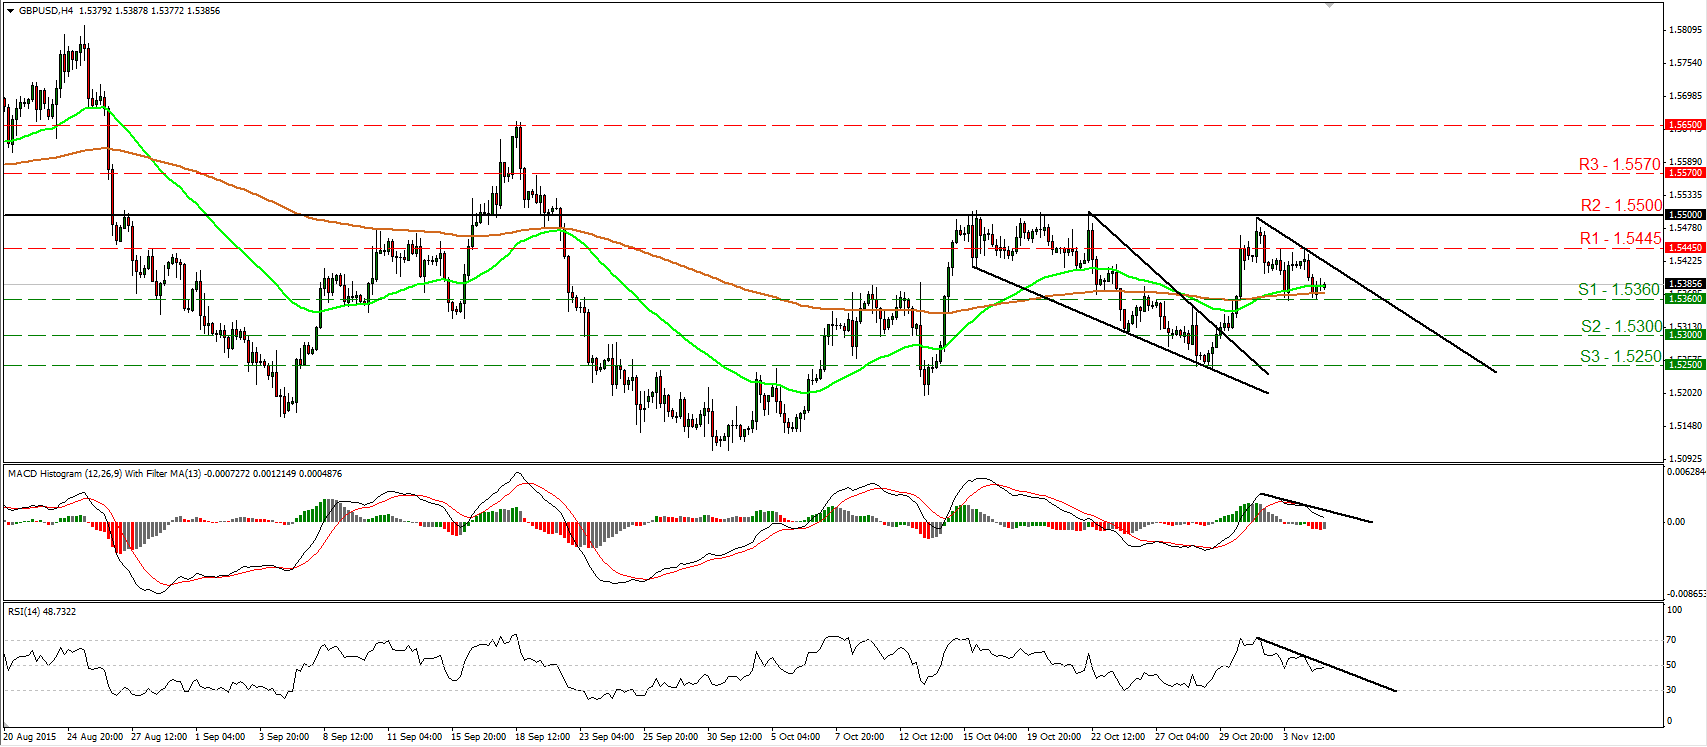
GBP/USD trades lower ahead of another “Super Thursday”
• GBP/USD traded lower yesterday after it hit resistance at 1.5445 (R1) to find support once again at 1.5360 (S1). Given the inability of the bulls to overcome the 1.5500 (R2) psychological zone, and having in mind that the pair printed a lower high at 1.5445 (R1), I would see a cautiously negative short-term picture. A clear break below 1.5360 (S1) is likely to confirm a forthcoming lower low on the 4-hour chart and could pave the way for the 1.5300 (S2) zone. Our momentum studies reveal downside momentum and support the notion. The RSI fell below 50, while the MACD, although positive, has topped and fallen below its trigger line. Also, both the indicators stand below their respective downside resistance lines. However, much of today’s movement will depend on the BoE meeting minutes and the Bank’s quarterly inflation report. The market will closely watch to see if any new members decide to join McCafferty in voting for a rate hike, and what would be the new inflation and growth projections of the Bank. On the daily chart, the rate still oscillates above and below the 80-day exponential moving average. Having that in mind, and that there is no clear trending structure, I would still hold a “wait and see” stance as far as the overall outlook of the pair is concerned.
• Support: 1.5360 (S1), 1.5300 (S2), 1.5250 (S3)
• Resistance: 1.5445 (R1), 1.5500 (R2), 1.5570 (R3)
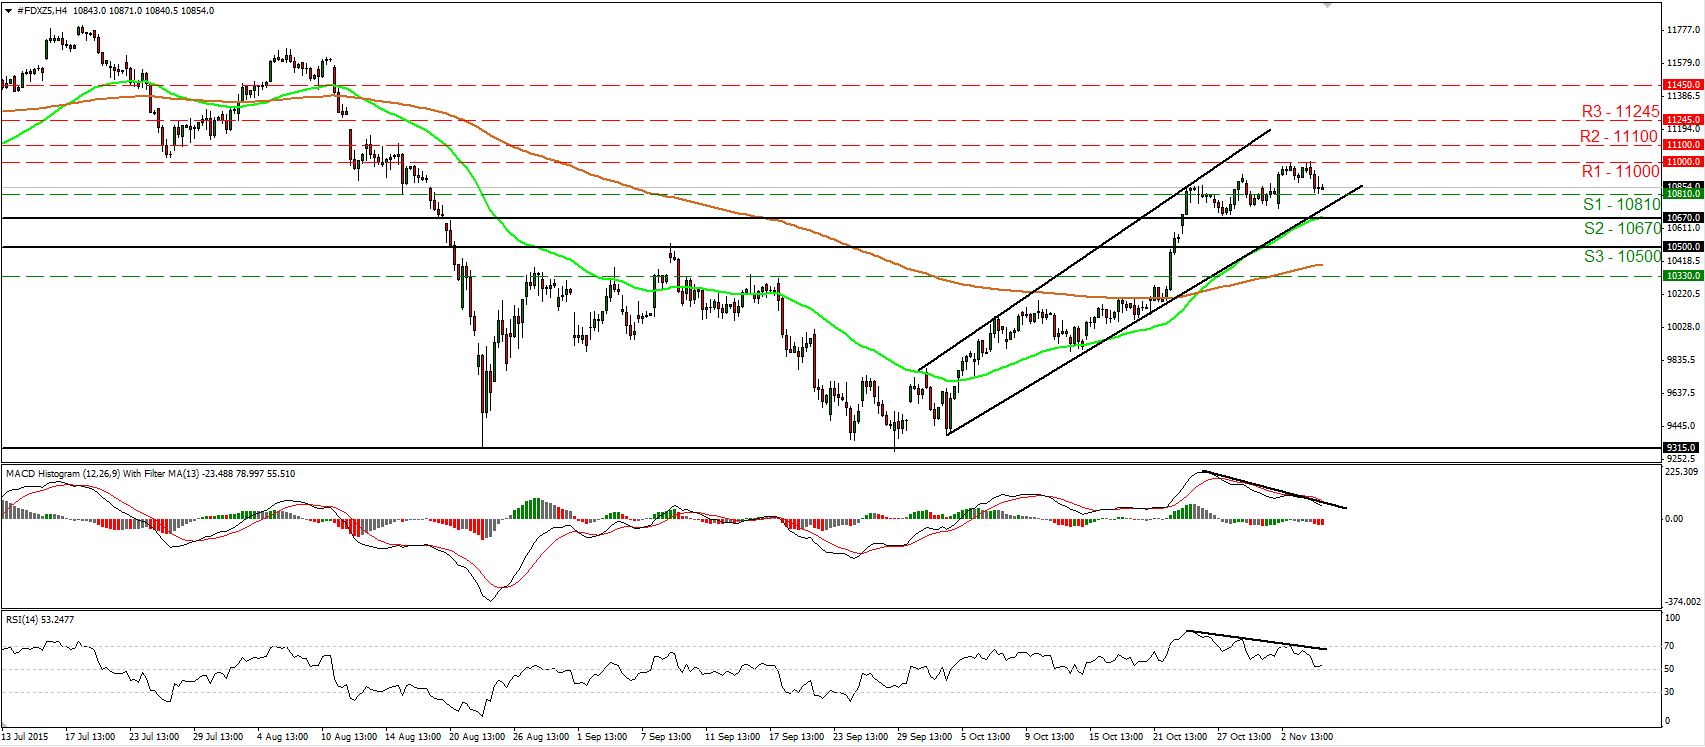
DAX futures hit 11000 and retreat
• DAX futures traded lower on Wednesday after it found resistance at the psychological zone of 11000 (R1). As long as the index is trading within the short-term upside channel that had been containing the price action since the 30th of September, I would consider the near-term path to stay positive. Thus, I would expect a break above 11000 (R1) to initially aim for the next resistance at 11100 (R2). Nonetheless, our short-term momentum studies reveal weakening momentum and give evidence that further setback could be looming before the bulls seize control again. The RSI edged down and hit support marginally above its 50 line, while the MACD, although positive, stands below its trigger line and points south. There is also negative divergence between these two indicators and the price action. On the daily chart, the break above the psychological zone of 10500 (S3) signaled the completion of a possible double bottom formation. Moreover, on the 23rd of October buyers managed to overcome the key obstacle of 10670 (S1). These technical signs support that the index is likely to continue trading higher in the foreseeable future. Personally, I would treat any possible near-term declines as a corrective move for now.
• Support: 10810 (S1), 10670 (S2), 10500 (S3)
• Resistance: 11000 (R1), 11100 (R2), 11245 (R3)
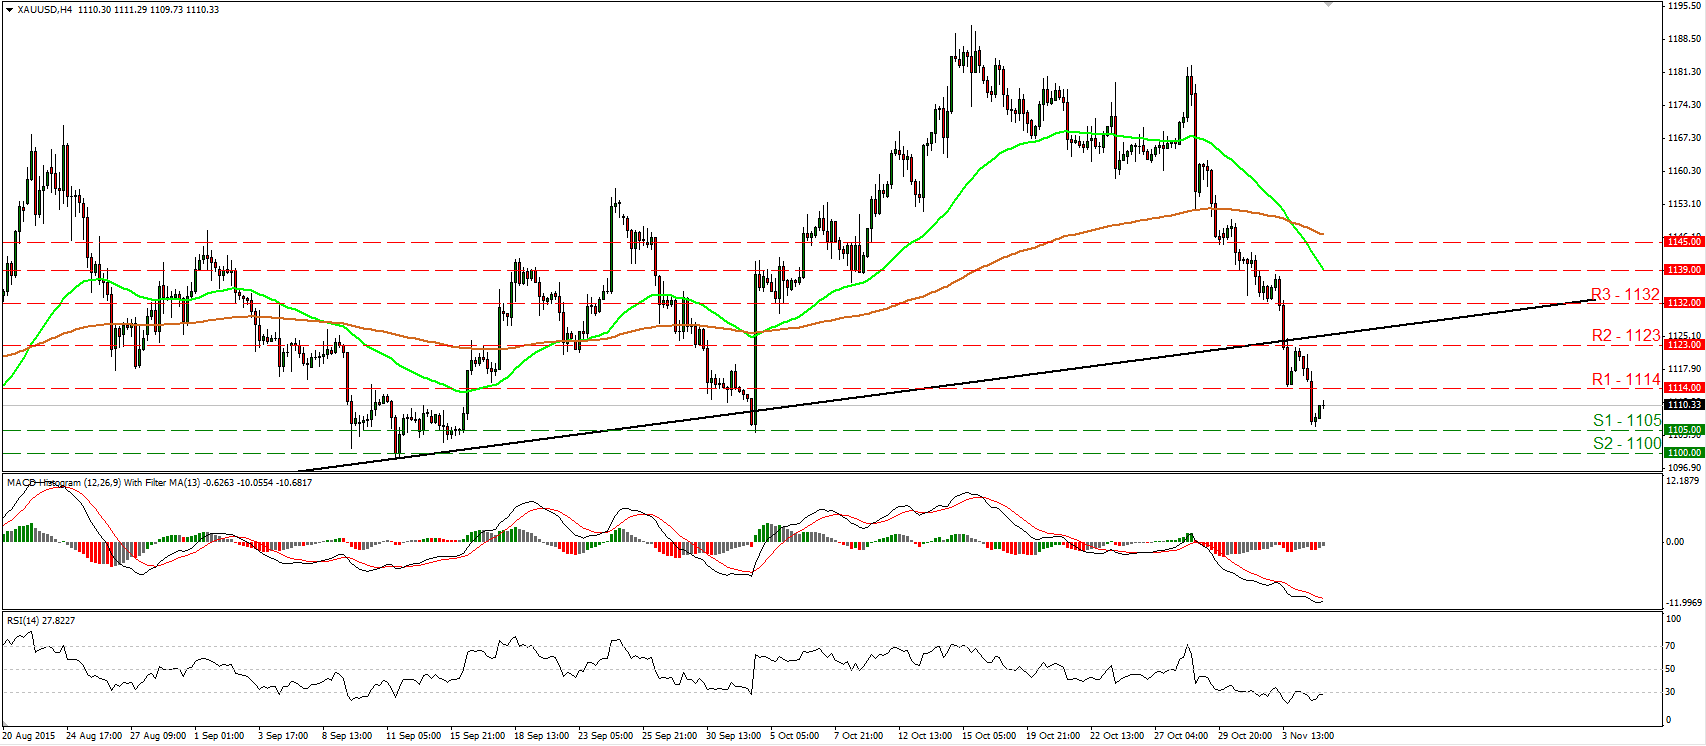
Gold continues south and hits support near 1105
• Gold continued trading lower on Wednesday, breaking below the support (turned into resistance) of 1114 (R1) to hit support fractionally above the 1105 (S1) obstacle. Then, the metal rebounded somewhat. The short-term trend remains negative in my view and thus, I would expect the bears to take control again at some point and push the rate for another test at 1105 (S1). A clear move below 1105 (S1) is likely to aim for the psychological zone of 1100 (S2). Nevertheless, looking at our short-term oscillators, I see signs for the current rebound to continue for a while before the next negative leg, perhaps to challenge the 1114 (R1) line as a resistance this time. The RSI has bottomed again within its below 30 territory, while the MACD shows signs of bottoming and could move above its trigger line soon. On the daily chart, the plunge below the upside support line taken from the low of the 20th of July has shifted the medium-term outlook cautiously to the downside and supports that the metal is poised to trade lower in the foreseeable future.
• Support: 1105 (S1), 1100 (S2), 1095 (S3)
• Resistance: 1114 (R1), 1123 (R2), 1132 (R3)
USD/JPY hits the upper bound of a sideways range
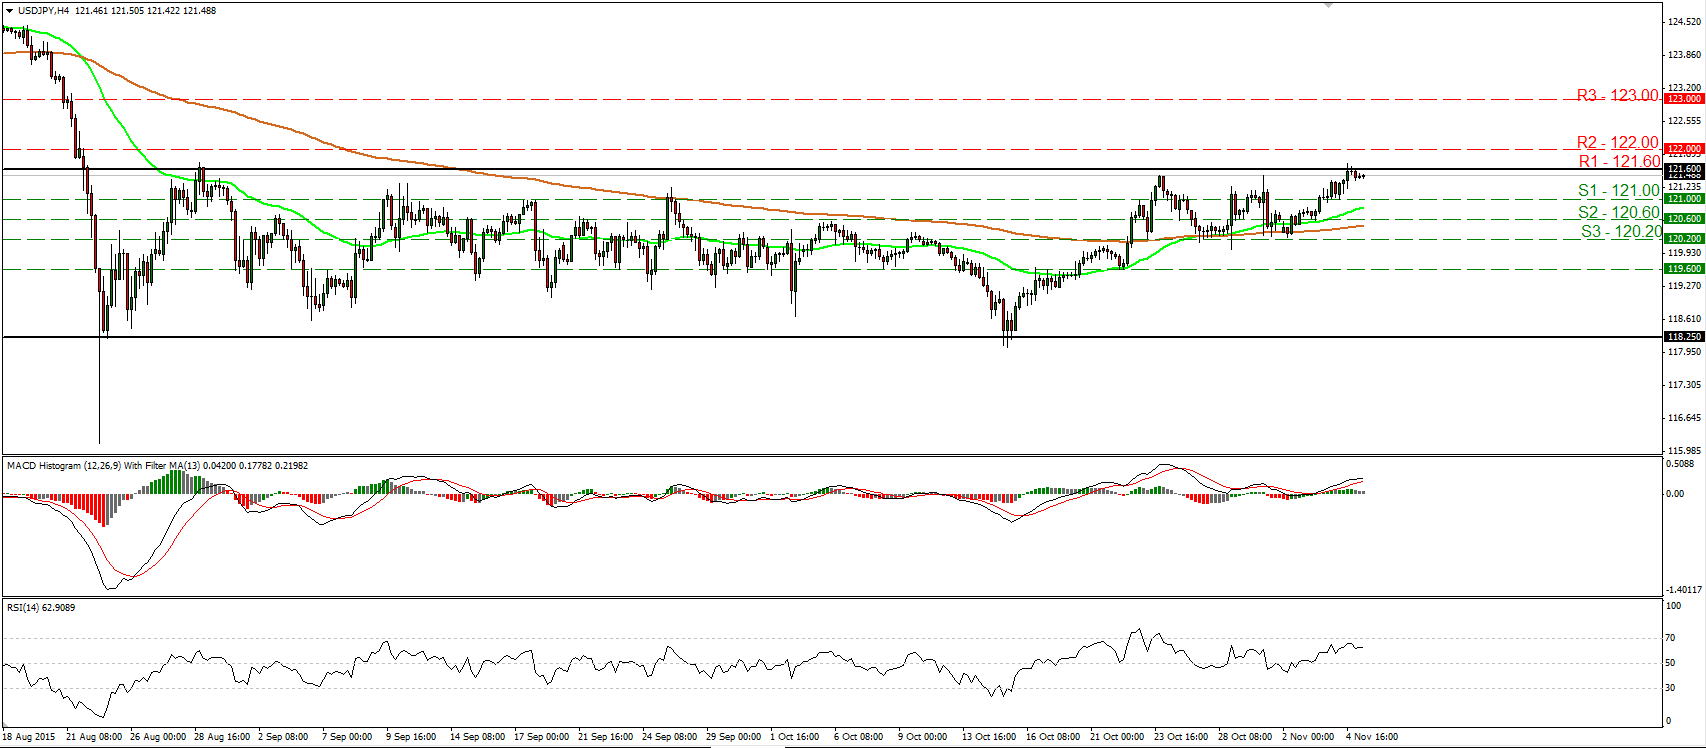
• USD/JPY traded higher yesterday and managed to hit the 121.60 (R1) barrier, the upper bound of the sideways range it has been trading since the last days of August. Having in mind that the pair is still within a sideways path, I would maintain my flat stance for now. A clear close above 121.60 (R1) is needed to signal the upside exit of that range, something that could initially aim for the 122.00 (R2) line. Nevertheless, I believe that a break above 122.00 (R2) is the move that could carry larger bullish extensions, perhaps towards our next resistance territory of 123.00 (R3). Our short-term oscillators detect upside speed but they give evidence that a minor setback could be on the cards before the bulls take the reins again. The RSI hit resistance slightly below its 70 line and turned down, while the MACD shows signs of topping. As for the broader trend, the plunge on the 24th of August signaled the completion of a possible double top formation, which turned the medium-term outlook somewhat negative. However, the strong rebound from the 116.00 zone and the fact that USD/JPY still gyrates around the 120.00 figure, corroborate my choice to stand aside at the moment.
• Support: 121.00 (S1), 120.60 (S2), 120.20 (S3)
• Resistance: 121.60 (R1), 122.00 (R2), 123.00 (R3)

