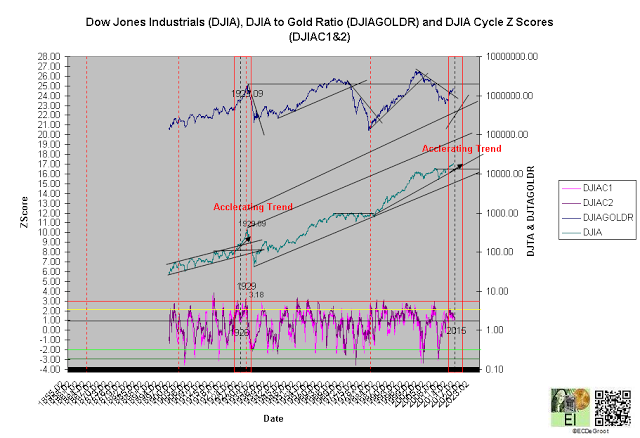
A phase transition or accelerating trend in the (Dow Jones Industrials) would likely play out as follows: (1) DJICA2, the longer of the two short-term cycles for US stocks would generally hold above 1 Z-Score during the failed decline (chart 1), and (2) the decline from peak to trough for DJICA2 (not price), if following a similar failed decline from 1925.10 to 1926.10, will be twelve months (chart 1). DJICA2 peak in November 2014 defines a cycle bottom in November.
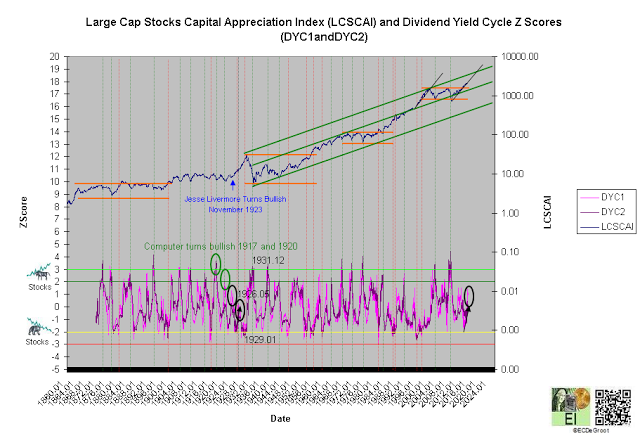
These conditions will be confirmed by 'the fundamentals' cycles of DYC1 and DYC2. DYC1, a short-term dividend cycle, for example, rose from -2.10 in 1925.01 to 0.21 in 1926.05 (chart 2). Extreme concentration and resulting positive flow, a message encouraging tighter risk management for bulls, foreshadowed a three month false failed decline from 1926.01. The failed decline, characterized by a backdrop of falling prices, rising dividend yields, headline-driven panic (similar to today), transferred control of the trend from the majority to minority.
Price which generally leads the cycle bottoms should bottom within three months. If either of the above conditions are violated for an extended period, either the timing of the phase transition has been shifted out or something else is evolving.
DJIA price levels and their corresponding intermediate- and long-term cycle Z-Score can be used to estimate possible outcomes for a phase transition in US stocks into 2017 (chart 3).
Chart 1
Chart 2


