🐂 Not all bull runs are created equal. November’s AI picks include 5 stocks up +20% eachUnlock Stocks

Exxon-Bullish Pattern At 35-year Support Line In Play

Published 09/12/2017, 07:07 AM
Updated 07/09/2023, 06:31 AM
US500
-
XOM
-

Exxon Mobil Corporation (NYSE:XOM) has little to brag about over the past 6-years, as its performance is flat and it has lagged the S&P 500’s gains by nearly 95% (See Chart Below). If one looks back 10-years, XOM hasn’t made any gains either. Could times be about to change?
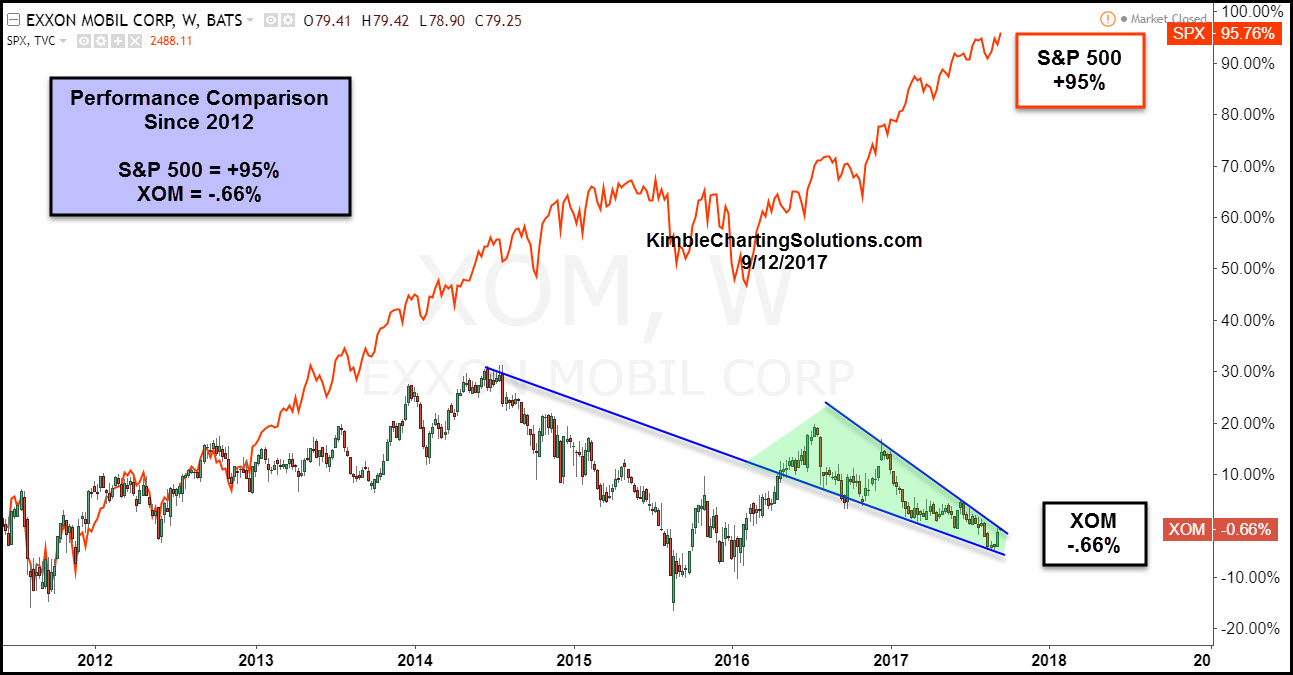
EXXON Mobil Chart

Other than collecting a nice dividend, it has been painful to own XOM over the past 6-years and the past decade, as its performance has been flat. Could this lagging performance be about to end? Exxon finds itself testing an important line in the sand below, that could tell us a ton about its future:
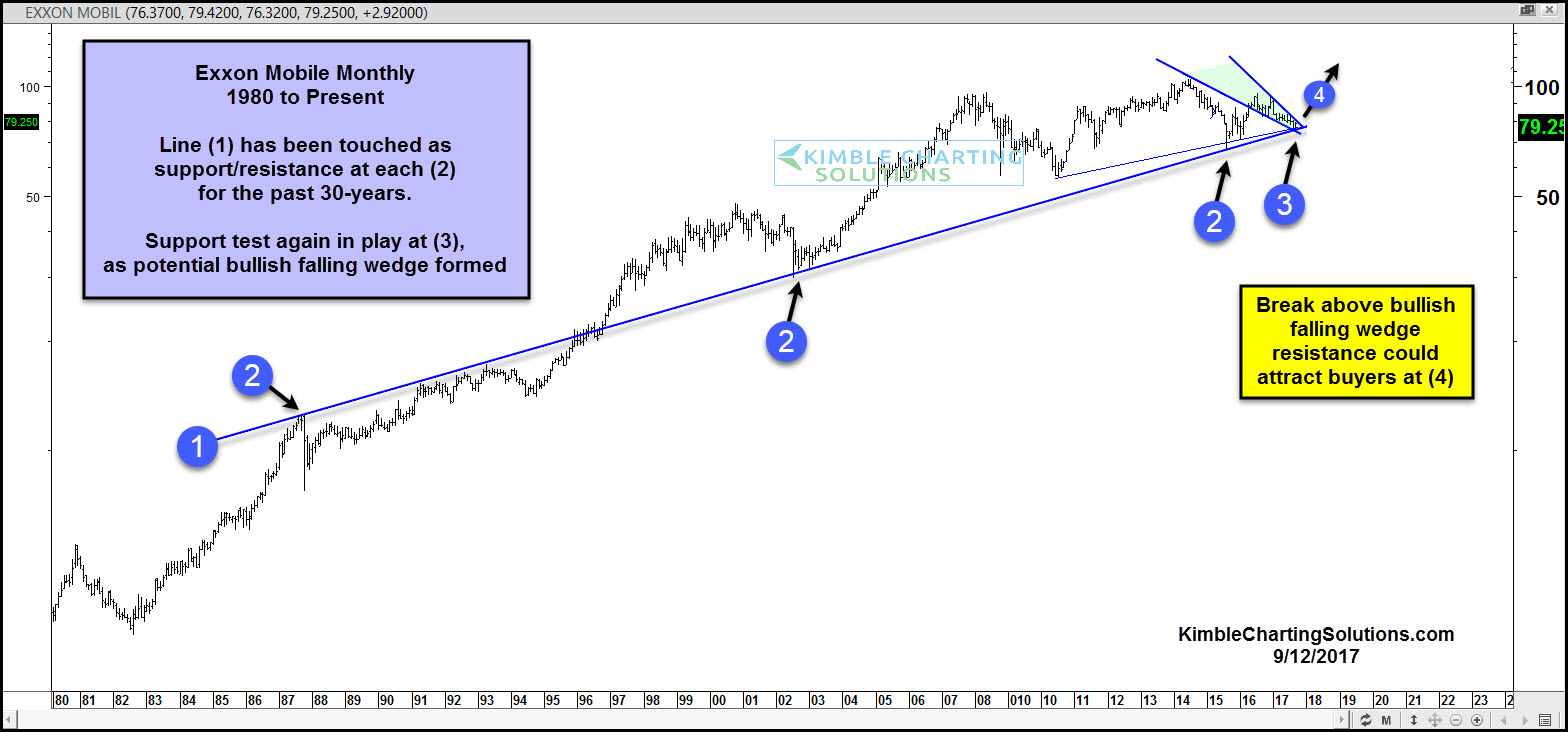
EXXON Mobil Monthly

Line (1) has been support/resistance several times at each (2) over the past 30-years. The decline over the past couple of years has XOM testing support line (1) at (3). While testing this line, XOM could be forming a bullish at (3).

The Power of the Pattern is of the opinion that if falling wedge resistance is taken out at (4), it could attract buyers to this out of favor company. A nice risk/reward set up is in play, as (1) becomes a nice stop loss for long positions, should selling pressure take place.

Latest comments

Loading next article…
Risk Disclosure: Trading in financial instruments and/or cryptocurrencies involves high risks including the risk of losing some, or all, of your investment amount, and may not be suitable for all investors. Prices of cryptocurrencies are extremely volatile and may be affected by external factors such as financial, regulatory or political events. Trading on margin increases the financial risks.
Before deciding to trade in financial instrument or cryptocurrencies you should be fully informed of the risks and costs associated with trading the financial markets, carefully consider your investment objectives, level of experience, and risk appetite, and seek professional advice where needed.
Fusion Media would like to remind you that the data contained in this website is not necessarily real-time nor accurate. The data and prices on the website are not necessarily provided by any market or exchange, but may be provided by market makers, and so prices may not be accurate and may differ from the actual price at any given market, meaning prices are indicative and not appropriate for trading purposes. Fusion Media and any provider of the data contained in this website will not accept liability for any loss or damage as a result of your trading, or your reliance on the information contained within this website.
It is prohibited to use, store, reproduce, display, modify, transmit or distribute the data contained in this website without the explicit prior written permission of Fusion Media and/or the data provider. All intellectual property rights are reserved by the providers and/or the exchange providing the data contained in this website.
Fusion Media may be compensated by the advertisers that appear on the website, based on your interaction with the advertisements or advertisers.
© 2007-2024 - Fusion Media Limited. All Rights Reserved.