This article was written exclusively for Investing.com
As measured by the Select Sector SPDR Energy ETF (NYSE:XLE), the energy sector has fallen by more than 50% in 2020. That is in stark contrast to the S&P 500, which is up around 4%.
The sector's steep decline has been led by the plunging oil price, which has dropped almost 40%, as global demand for the commodity has shriveled up due to the coronavirus pandemic. However, someone is betting that the energy sectors worse days are behind it, and betting that the XLE rises sharply by the middle of January.
It is not just the XLE, which is starting to see some bullish momentum. Exxon Mobil Corp. (NYSE:XOM), along with Chevron Corp. (NYSE:CVX), has the most significant weighting in the ETF. Now Exxon, along with the XLE, is beginning to see some bullish betting too, also suggesting the sector is ready to turn for the better.
A Rebounding Sector
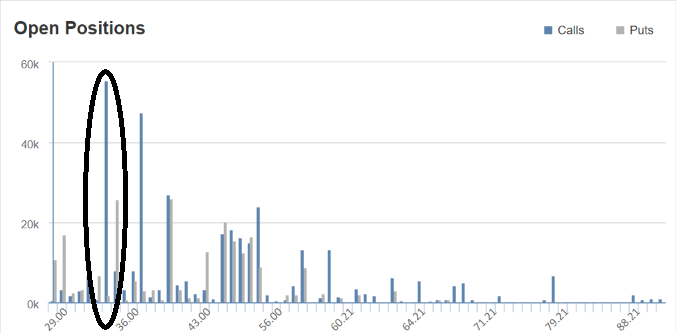
On Sept. 25, the open interest levels for the Jan. 15 $34 calls increased by 51,000 contracts. The data shows that 49,600 of the contracts traded on the ask for about $1.20 per contract. It is a bullish bet, indicating the value of the XLE will be above $35.20 by the middle of January. It is a rather large bet too, making it so interesting, with premiums paid of almost $6 million.

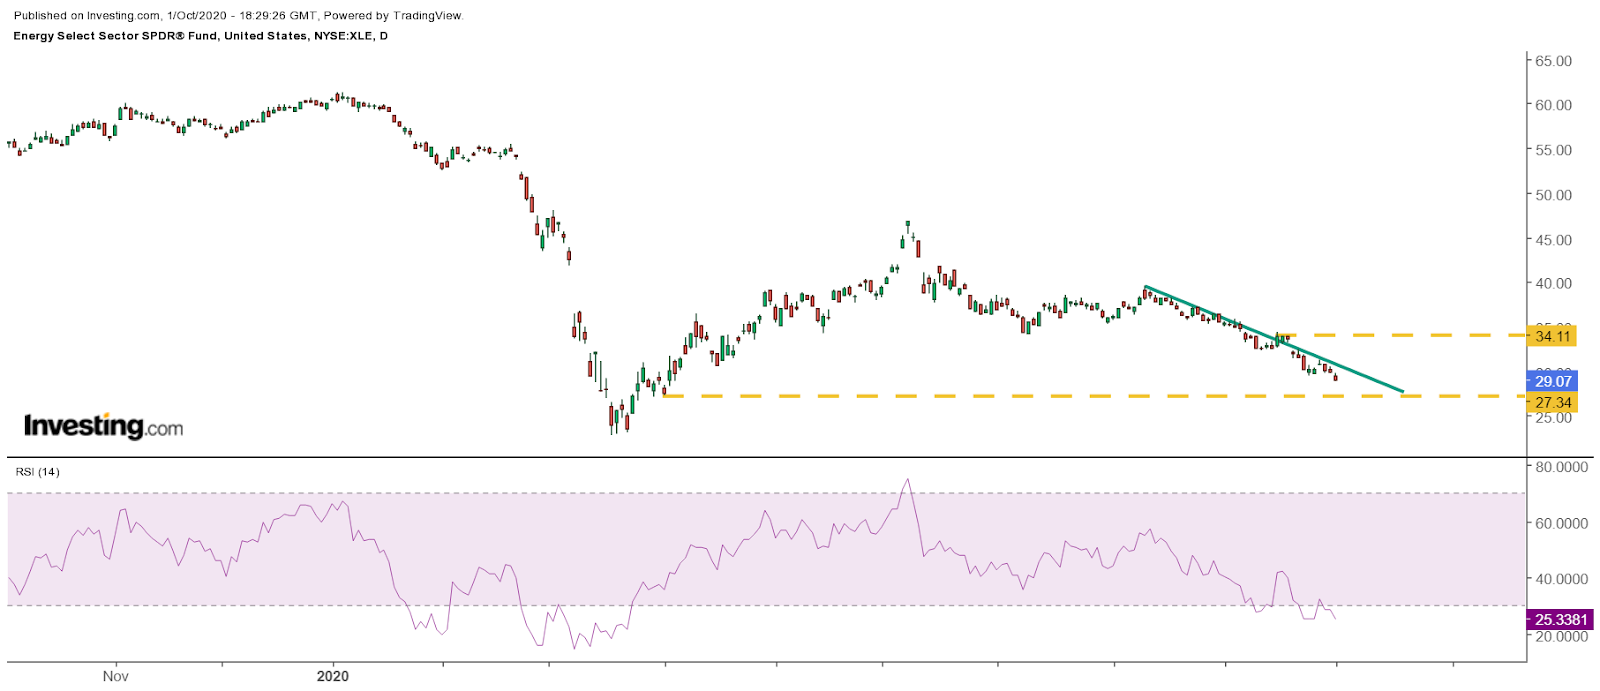
Additionally, the XLE is beginning to show some signs of a potential bottom forming, based on the technical chart. The ETF may now be entering into oversold territory. The relative strength index has fallen below 30; when an RSI reaches these levels, it indicates oversold conditions.
However, the chart suggests there may be more downside before a turn higher, with its next level of support around a price of $27.50. However, should the XLE rise above resistance at $30.70, it could go on to climb to around $34.50.

Betting Exxon Turns Around
Exxon is starting to see some bullish momentum as well. The open interest levels for the Dec. 18 $45 calls increased by about 11,000 contracts. The data shows that these calls traded on the ask and were bought for about $0.25 per contract. It is a bullish bet that indicates Exxon stock is above $45.25 by the time the middle of December comes around.
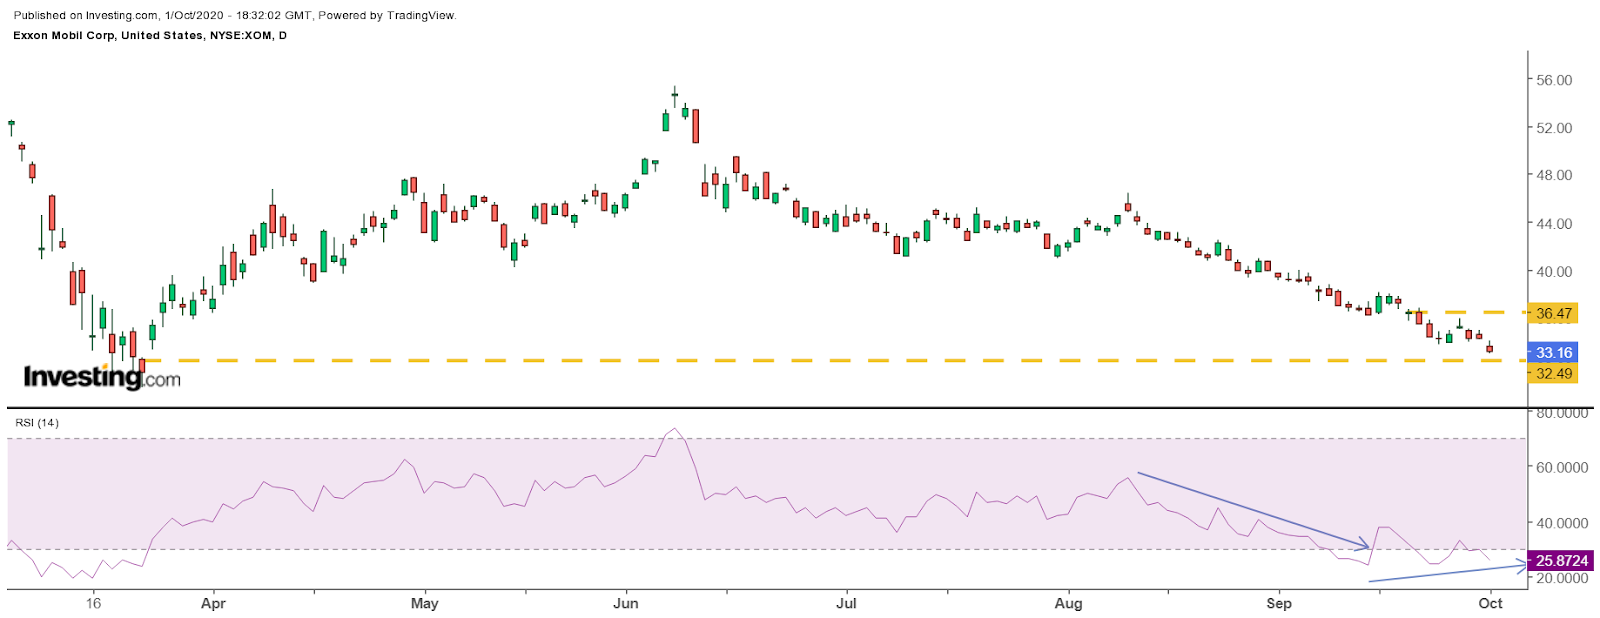
Exxon now appears to be filling a technical gap created after the March lows around a price of $32.50. Additionally, the RSI on Exxon has now reached below 30 on two occasions. It is beginning to show signs of a trend reversal, indicating a potential bottom in the stock. If the ETF were to reverse higher, its next meaningful level of technical resistance would come around $36.50.

Oil prices have recently fallen under pressure, as worries over global demand and rising supplies continue to make investors nervous. However, should global demand begin to pick up and the coronavirus fade, it could bring optimism back for economic growth. It may even be the reason a trader is willing to make a substantial bullish bet on the beaten down energy sector.
