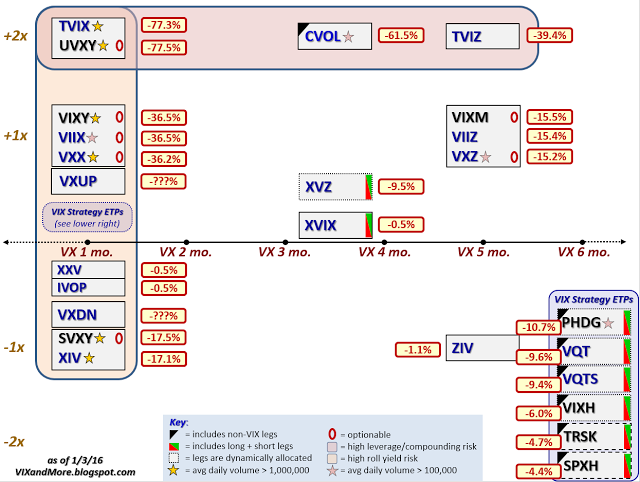
Just one month ago, in The Current VIX ETP Landscape, I plotted all 24 VIX exchange-traded products with respect to leverage and maturity, using leverage on the Y-axis and maturity on the X-axis. I also included a half dozen VIX strategy ETPs that have no easily discernable point on the leverage-maturity grid. Depending on how finely you wish to split hairs, these 24 ETPs cover approximately 17 unique ways to trade volatility long and short, across various maturities and according to a wide variety of strategic approaches.
The big story is that in 2015, not one of those VIX ETPs was profitable. In fact, the mean VIX ETP lost over 21% for the year. This means that in those instances where there are long and inverse pairs – notably the iPath S&P 500 VIX Short-Term Futures Exp 30 Jan 2019 (N:VXX) and VelocityShares Daily Inverse VIX Short Term linked To SP 500 VIX Short Fut Exp 4 Dec 2030 (O:XIV) as well as iPath S&P 500 VIX Mid Term Futures Exp 30 Jan 2019 (N:VXZ) and VelocityShares Daily Invers VIX (O:ZIV) – both the long and short versions of the same volatility trading idea lost money.
This all happened in a year in which the VIX fell a mere 5.2% from the beginning to the end of the year. While contango was a factor during the course of the year, contango affecting the front month and second month VIX futures averaged a relatively mild 4.3% per month during the year, while contango between the fourth month and seventh month was slightly above average at 1.6% per month.
The biggest culprit affecting the declines were the huge moves in volatility, with three one-day VIX spikes of greater than 30% occurring in the space of two months. The large volatility spikes had a considerable impact on end-of-day rebalancing, leading to volatility compounding price decay.
One last technical note, with respect to the AccuShares Spot CBOE VIX Up (O:VXUP) and AccuShares Spot CBOE VIX Down (O:VXDN) products: I have yet to see AccuShares or anyone else attempt to calculate the performance of these products for 2015. Given the chaos created by regular, special and corrective distributions, in addition to reverse splits and stock dividends, calculating performance for these two ETPs is not a project I have the inclination to tackle right now. That being said, until I see the calculations, I cannot be 100% sure that VXUP had a losing year in 2015. Consequently, in the event that VXUP did post a gain, this would be a good time for AccuShares to post some performance data and claim at least one public relations victory in this space.
To the broader audience, if you happen to be sitting on an idea for a VIX or volatility-based ETP that would have been a winner in 2015, this is an interesting time to consider moving forward with that idea.
Looking ahead, I will have a lot more to say about VIX ETP strategies, VIX ETP performance and related subjects going forward.

Disclosure(s): net short VXX and VIX; net long XIV and ZIV at time of writing
