In the insurance industry, the property and casualty insurers are the major beneficiaries of an improving rate environment. The interest rate environment has been slowly on the better end with Fed (Federal Reserve) raising interest rates thrice in three consecutive quarters (0.25% in December 2016, 1% in March 2017 and 1.25% in June 2017). This reflects Fed’s confidence in the improving U.S. economy.
The Fed had earlier indicated of three interest rate hikes in 2017, of which, two have already been made by the first half of 2017. An increased rate is expected to positively impact the net investment income, a major component of an insurer’s top line. A broader invested asset base and alternative asset classes are other positives.
Underwriting results, the major indicator of profitability for any insurer, will remain volatile owing to occurrence of catastrophes. Per Aon Benfield, the global reinsurance intermediary and capital advisor of Aon plc (NYSE:AON) , the estimated amount of global catastrophe losses is $53 billion in the first half of 2017, the highest since 2011. Underwriting results will thus suffer as catastrophes are on the rise.
Nonetheless, improving economy indicating more disposable income and better consumer sentiment should support more policy writings, thus driving the premiums higher. Influx of capital, building of reserves and containment of underwriting expenses also pave the way for growth prospects.
Though the Property and Casualty Insurance industry is currently ranked at #203 (lies at the bottom one-third of the Zacks Industry Rank for 252 plus industries), it has outperformed the S&P 500 in a year by registering a rally of 19.3%. The index on the other hand climbed 10.9%.

Here we focus on two property and casualty insurers. Everest Re Group Ltd. (NYSE:RE) writes property and casualty, reinsurance and insurance in the United States, Bermuda and international markets, while XL Group Ltd (NYSE:XL) is a leading global provider of insurance, reinsurance and financial risk solutions for enterprises and insurance companies. While Everest Re has a market capitalization of $10.8 billion, XL Group has $11.3 billion of the same.
Both stocks carry a Zacks Rank #3 (Hold). It will be interesting to note which stock is better positioned in terms of fundamentals.
A better-ranked stock from the same industry is Markel Corporation (NYSE:MKL) , flaunting a Zacks Rank #1 (Strong Buy). You can see the complete list of today’s Zacks #1Rank stocks here.
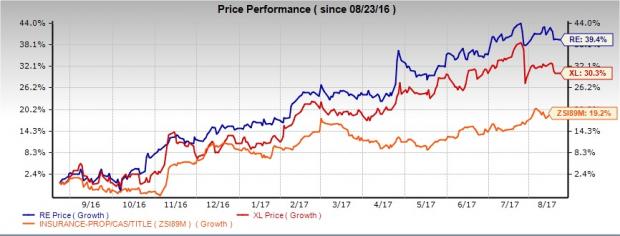
Price Performance
Both Everest Re and XL Group have outpaced the industry with shares surging 39.4% and 30.3%, respectively. Here, Everest Re emerges a clear winner.

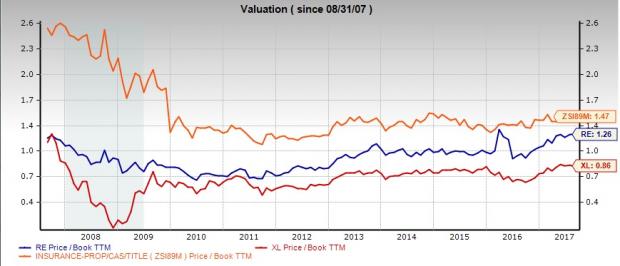
Valuation
The price to book value metric is the best multiple, used for valuing insurers. Compared with Property and Casualty Industry’s P/B ratio of 1.47, Everest Re is underpriced with a reading of 1.26. Meanwhile, XL Group is much cheaper with a trailing 12-month P/B multiple of 0.86. This round goes to XL Group as the company’s shares are cheaper than Everest Re’s.
Debt-to-Equity
Both XL Group and Everest Re have lower debt-to-equity versus the industry average of 33.31%. Everest Re with a leverage ratio of 7.38 has an edge over XL Group with the same of 24.48.

Return on Equity
Everest Re’s return on equity of 13.60% outpaced the industry average of 6.18%. However, XL Group’s return on equity of 4.88% underperformed the industry. Everest Re thus wins this round.

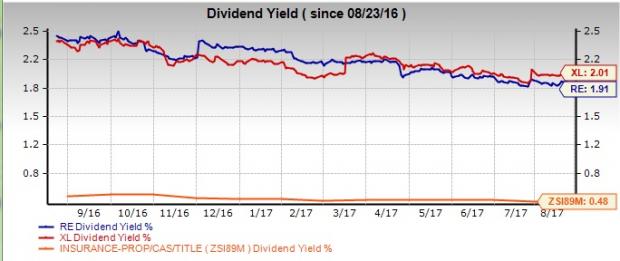
Dividend Yield
In a year’s period, Everest Re’s dividend yield was 1.91%, while XL Group’s was 2.01%. Both have a dividend yield that outshines the industry’s average of 0.49%. Comparatively, XL Group has an edge over Everest Re.
Earnings Surprise History
Regarding the companies’ surprise history, XL Group has surpassed the Zacks Consensus Estimate in the last four quarters with an average beat of 14.89%. Whereas, Everest Re delivered positive surprises in the last four quarters with a four-quarter average beat of 46.59%.
Everest Re has an edge over XL Group.
Earnings Estimate Revisions and Growth Projections
XL Group’s 2017 estimates have inched up 1.9% but slid 2.9% for 2018 in the last 30 days. On the other hand, Everest Re’s 2017 estimates have moved up 2.6% and 1.3% for 2018 over the same time frame.
For XL Group, The Zacks Consensus Estimate for earnings per share is $3.25 for 2017, reflecting a year-over-year surge of 99.08%. For 2018, the Zacks Consensus Estimate for earnings per share is pegged at $3.97, representing a year-over-year rise of 22.39%. XL Group has long-term expected earnings per share growth of 9.0%.
For Everest Re, The Zacks Consensus Estimate for earnings per share is $21.42 for 2017, reflecting a year-over-year decline of 9.3%. For 2018, the Zacks Consensus Estimate for earnings per share is pegged at $20.23, representing a year-over-year decrease of 5.6%. Everest Re has long-term expected earnings per share growth of 10.0%.
This round therefore goes equally to both the companies.
To Conclude
Everest Re holds an edge over XL Group on price performance, leverage, return on equity and the earnings surprise history. Considering parameters like valuation and dividend yield, XL Group seems better poised than Everest Re. However, based on our comparative analysis, Everest Re presently has an advantage over XL Group.
Zacks' 10-Minute Stock-Picking SecretSince 1988, the Zacks system has more than doubled the S&P 500 with an average gain of +25% per year. With compounding, rebalancing, and exclusive of fees, it can turn thousands into millions of dollars. But here's something even more remarkable: You can master this proven system without going to a single class or seminar. And then you can apply it to your portfolio in as little as 10 minutes a month. Learn the secret >>
Aon PLC (AON): Free Stock Analysis Report
XL Group Ltd. (XL): Free Stock Analysis Report
Everest Re Group, Ltd. (RE): Free Stock Analysis Report
Markel Corporation (MKL): Free Stock Analysis Report
Original post
