Forex Trading Strategies
Taken Positions
EUR/USD: long at 1.1100, target 1.1320, stop-loss 1.1010, risk factor **
GBP/USD: long at 1.5245, target 1.5420, stop-loss 1.5160, risk factor ***
USD/CHF: short at 0.9410, target 0.9280, stop-loss 0.9460, risk factor ***
EUR/GBP: long at 0.7260, target 0.7450, stop-loss 0.7210, risk factor ***
EUR/CAD: long at 1.3800, target 1.4100, stop-loss 1.3700, risk factor **
GBP/JPY: long at 191.00, target 195.00, stop-loss 189.70, risk factor **
Pending Orders:
AUD/USD: buy at 0.7600, if filled - target 0.7800, stop-loss 0.7500, risk factor ***
EUR/CHF: buy at 1.0440, if filled - target 1.0680, stop-loss 1.0375, risk factor **
EUR/JPY: buy at 139.20, if filled - target 141.00, stop-loss 138.20, risk factor **
CHF/JPY: buy at 133.10, if filled - target 135.00, stop-loss 132.50, risk factor **
EUR/USD: Profit Taken On EUR Short After Non-Farm Payrolls, But Now It Is Time To Get Long Again
(long at 1.1100)
- US non-farm payrolls increased 280k last month, the largest gain since December and much more than the median forecast of 225k. In addition, payrolls for March and April were revised to show 32k more jobs created than previously reported, giving the report a healthy glow.
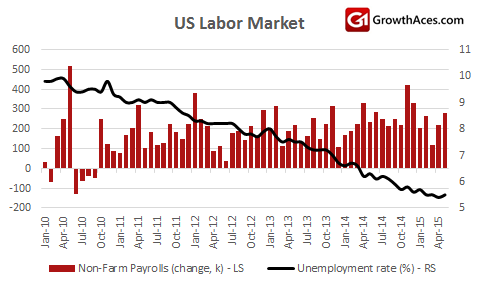
- The unemployment rate rose to 5.5% from a near seven-year low of 5.4% in April. That was because more people, including new college graduates, entered the labor force. Despite May's rise in the jobless rate, it remains not too far from the 5.0-5.2% range that most Fed officials consider consistent with full employment. Policymakers will also be encouraged by the return of some discouraged job seekers to the labor market. The labor force participation rate, or the share of working-age Americans who are employed or at least looking for a job, increased 0.1 percentage point to 62.9%, a four-month high. The number of discouraged workers in May was the lowest since October 2008.
- Average hourly earnings, which had long been the missing piece in the jobs recovery and one closely watched by Fed policymakers, rose 8 cents. Over the year, average hourly earnings have risen by 2.3%, the largest rise since August 2013.
- New York Fed President William Dudley said he still expects the Fed will be in position to raise rates later this year - but only if growth rebounds from a weak first half, and there is more progress on lowering the unemployment rate. He said the rate path will likely be shallow, though the central bank will adjust based on how financial markets respond. Dudley said that now that oil prices have at least stabilized, he is at least becoming more confident that inflation will eventually rise to the Fed's 2% target.
- After a weaker beginning of the year, the German economy is starting the second quarter on stronger footing. After falling in March, the 0.9% monthly rise in German industrial production was better than the consensus forecast of a 0.5% rise. It left the annual growth rate at 1.4%, its fastest pace in nearly a year. German trade data revealed a healthy 1.9% monthly rise in export values in April, suggesting that German companies are feeling benefits of a weaker EUR.
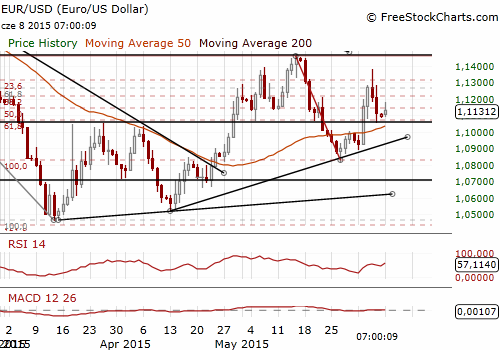
- The EUR/USD fell strongly after non-farm payrolls on Friday, in line with our expectations. We took profit on our short position at 1.1100. But we do not expect the EUR/USD fall to be continued. We went long at 1.1100 and our target is 1.1320, in the area of hourly highs on June 4. The EUR edged up today partly on rising Bund yields and better-than-expected German industrial output data, which suggested that Europe's largest economy got off to a good start in the second quarter. We hope for stronger EUR/USD gains in the first half of the week, as we see a risk of better US retail sales data on Thursday.
Significant technical analysis' levels:
Resistance: 1.1200 (psychological level), 1.1280 (high Jun 5), 1.1318 (hourly high Jun 4)
Support: 1.1067 (100-dma), 1.1057 (10-dma), 1.1049 (low Jun 5)
USD/JPY: Japan’s GDP Revised Much Stronger Than Expected
(stay sideways)
- The economy grew an annualised 3.9% in the first three months of this year, beating a preliminary estimate of a 2.4% gain, and topping a median market estimate for 2.7% growth. On a quarterly basis, the economy grew 1%, compared with the initial estimate of a 0.6% increase.
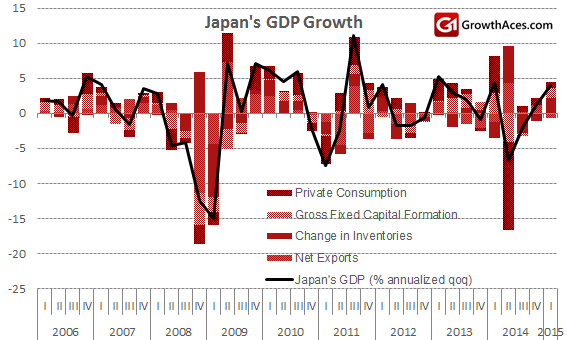
- Capital spending rose 2.7% from the previous quarter, much more than a preliminary estimate of 0.4% growth. Taking advantage of a weak JPY, a number of Japanese manufacturers are shifting production back to Japan from China and elsewhere. Rising inventories also contributed to the upward revision.
- Private spending accounts for nearly two-thirds of Japan's economy and it rose 0.4% in the first quarter. Exports and public spending, meanwhile, continue to drag on growth.
- The data is welcome news for the government and the Bank of Japan, which are hoping that expectations of a steady economic recovery will spur companies and households to boost spending.
- Japan posted a current account surplus for the tenth straight month in April, as declining crude oil prices pushed down imports and the JPY's depreciation boosted income from abroad. The surplus stood at JPY 1,326.4 billion. Exports rose 4.1% to JPY 6,228.7 billion, while imports dropped 5.9% to JPY 6,374.9 billion. The surplus in the primary income account, which reflects how much Japan earns from its foreign investments, expanded 19.1% to JPY 2,197.1 billion. The JPY's depreciation also helped attract foreign tourists to Japan, bringing the travel balance to a record surplus of JPY 133.4 billion since comparable data became available in 1996.
- Japan's service sector sentiment index slipped to 53.3 in May from 53.6 in April, down for the first time in six months. The outlook index, indicating the level of confidence in future conditions, climbed to 54.5 in May from 54.2 the previous month.
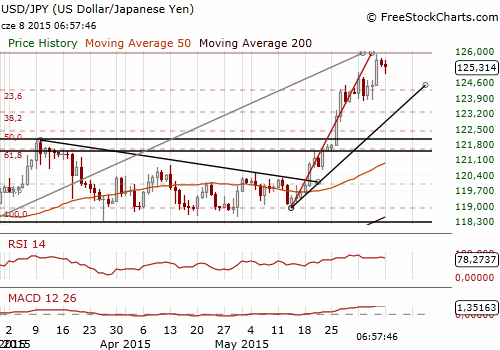
- The USD/JPY hit at 13-year high of 125.86 on Friday after a robust US jobs report. After stronger-than-expected Japan’s GDP revision, the rate fell and we see the potential for even deeper corrective move in the first half of this week. We have withdrawn our buy order on the USD/JPY and stay sideways now, but will be looking to go long on dips.
Significant technical analysis' levels:
Resistance: 125.60 (hourly high Jun 8), 125.68 (session high Jun 8), 125.86 (high Jun 5)
Support: 124.99 (session low Jun 8), 124.36 (low Jun 5), 123.78 (low Jun 4)
USD/CAD: Robust Job Gains In Canada
(stay sideways)
- Canada's economy added a higher-than-expected 58.9k jobs in May. The market had expected a gain of 10k jobs. Compared with the previous month, the economy added 30.9k full-time jobs and 27.9k part-time jobs. Manufacturing firms added 21.5k positions, with employment in the sector rising for the second month in a row. Gains were seen in a variety of other industries, including an increase of 20.7k jobs in health care and social assistance and 16.8k in trade. The natural resources sector, which includes oil and gas extraction, shed 2.4k jobs. Overall job creation was concentrated in the private sector, which added 56.8k positions, while the public sector lost 19.1k jobs.
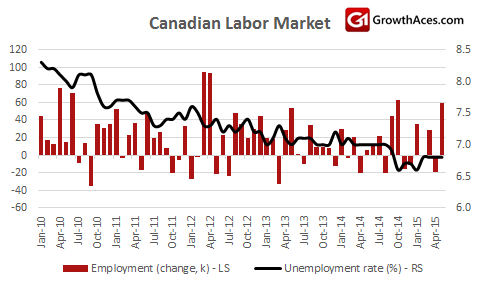
- There was no change in the unemployment rate in May, which remained at 6.8%. Participation rate was recorded at 65.9%, up from 65.8% in April.
- The annualized average hourly wage growth in May showed an increase of 2.9% compared to April's yoy increase of 2.4% yoy.
- The CAD rebounded on Friday despite USD rally on US employment data and outperformed all its currency counterparts, as jobs growth in Canada had its biggest jump in seven months. We did not take any position on the USD/CAD on Friday due to elevated risk, but we took quite significant profit on our EUR/CAD short position.
- We stay sideways on the USD/CAD in the short term. However, in our opinion, the CAD has the upside potential that will emerge in the medium to longer term because of improving Canadian macroeconomic figures, diminishing likelihood of BOC monetary easing and gradually increasing oil prices.
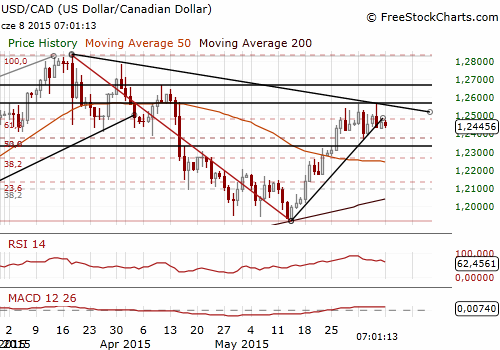
Significant technical analysis' levels:
Resistance: 1.2563 (high Jun 5), 1.2570 (high Apr 15), 1.2603 (high Apr 14)
Support: 1.2422 (session low Jun 8), 1.2385 (low Jun 3), 1.2368 (low Jun 2)
Source: Growth Aces Forex Trading Strategies
