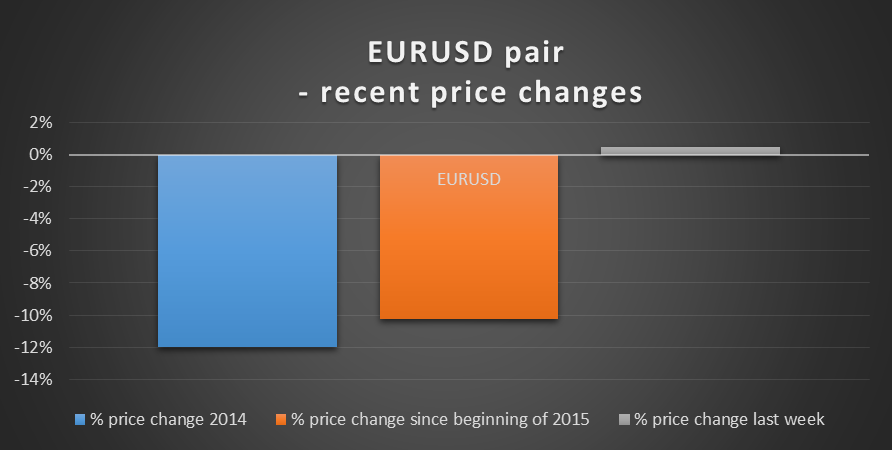
EUR/USD has been in a well documented downtrend for some time – trading around 1.085 at the time of writing it is just off its all time low of under 1.05. The graph below summarises the recent experience.

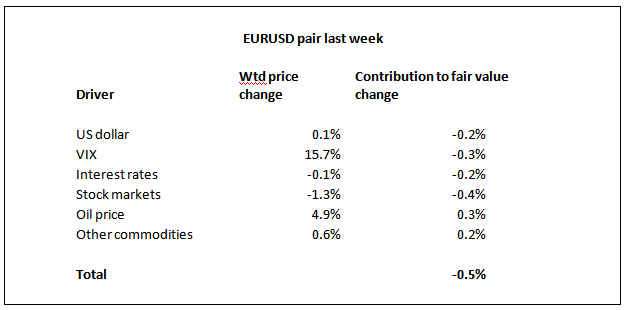
Over the last week, the pair rose 0.5%, which was accompanied by a 0.5% decrease in its fair value. The table below analyzes the fair value movement:

A combination of fair value decrease and price increase would normally be a signal to sell the pair. Following this signal over the last 90 days would have provided an annualized gain of 23.8% with volatility of 13.0%.
We find a fair value of EUR/USD at just over $1.04, suggesting that the pair is overvalued and confirming the signal analyzed above. Trading the pair using this indicator over the 90 day back test period showed an annualized return of 43% with volatility of 13.5% - essentially the fair value lay below the then current price all the way through the recent period of decline.
Our signal based on the lead given by the change in the Baltic Dry Index (BDI) of raw material shipping freight rates provides the only dissent. Based on the relationship between the BDI and EUR/USD over the last six years and the 10% rise in the BDI over the last month, a short term increase in EUR/USD is suggested by this indicator.
Trading this signal would have yielded a 7.6% per annum gain with volatility of 12.5% over the last six years.
Relationship to drivers and volatility
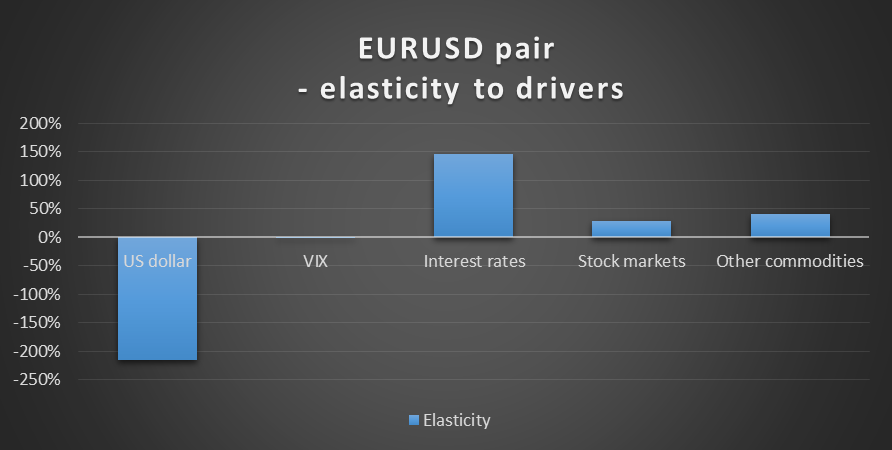
The graph below shows the sensitivity of the pair’s fair value to its drivers:

Our fair value indicators now suggest some short term upside in the US dollar index which poses a risk factor to the trade recommended above.
The USD may undergo some volatility this week if the jobs data reads come in some distance from consensus. Given the sensitivity of the pair to the USD evident in the above graph, this could translate into volatility in EUR/USD. The current week is also a data-rich one for the euro area with the German jobs data, G7 meeting, EMU CPI reading and ECB Monetary Policy Meeting Accounts all on the schedule.
For the last three years, the volatility of EUR/USD in the week leading up to the US nonfarm payrolls print has been 8% higher than the volatility for all weeks over the period.
Trading currencies and commodities can provide useful diversification to a US equity portfolio (ie. lower volatility and higher return). A portfolio of 5% allocated to EUR/USD (traded as recommended in this article) and 95% allocated to the S&P 500 index had a volatility of 12.4% over the last 90 days vs 13.2% for 100% in the S&P 500. The annualized returns were -2.9% (5% allocated to pair) vs -4.5% (100% S&P 500).
