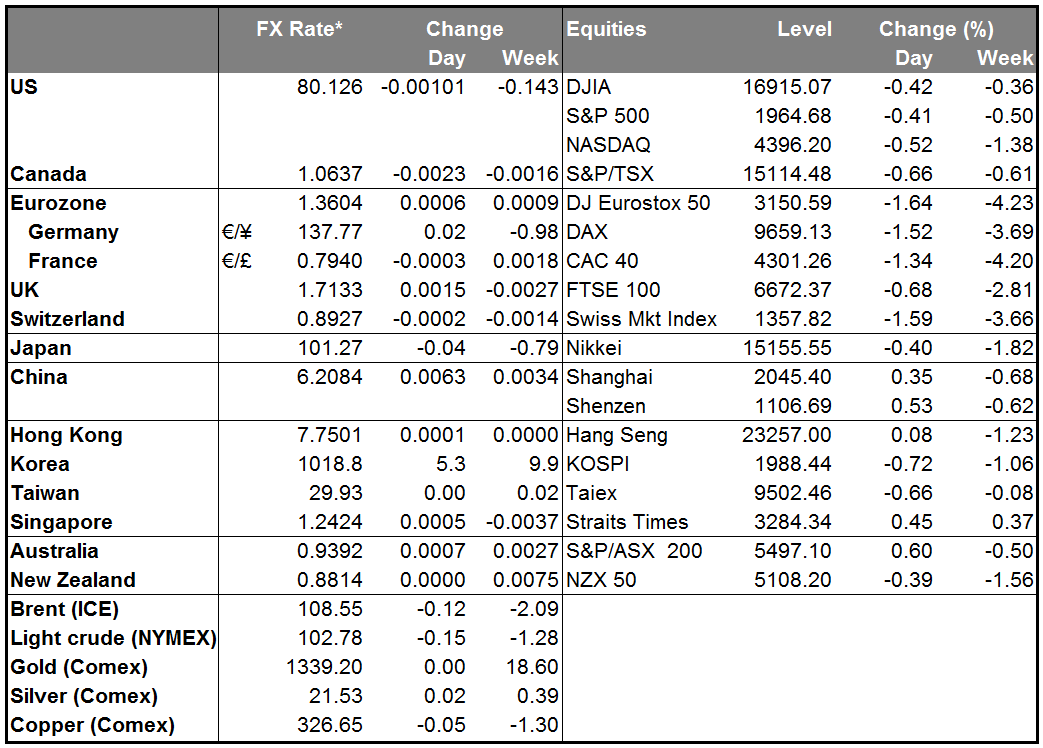
Eurozone banking system in the spotlight again Once again, the health of the European banking system is in the spotlight, and what it reveals isn’t very pretty. Shares in Portugal’s second-largest bank, Banco Espirito Santo (LISBON:BES) SA, were suspended in trading Thursday on concern about its financial health after one of its parent companies, Espirito Santo International (ESI), missed some payments on its commercial paper. ESI owns 49% of Espirito Santo Financial Group (ESFG), which in turn owns 25% of the bank. The Portuguese central bank says that Banco Espirito has been “adequately isolated” from the parent company’s problems, but the market clearly does not believe this. There are apparently concerns that some holders of the ESI commercial paper may try to make a claim against the bank.
The news has brought to the fore again the problems facing European banks, particularly those of the European periphery (Ireland, Portugal, Spain, Italy and Greece), which have not yet fully recovered from the financial crisis. Moreover, the EU has not yet finalized its rules for how to deal with struggling banks. Ultimately, the market may be expressing its doubts about whether the ECB’s planned targeted long-term refinancing operation (TLTRO) will be able to get European banks lending again and revive the flagging Eurozone economy. Thursday’s news also showed sharp falls in industrial production in France and Italy in May, in line with earlier reports of declines in output in Germany and Spain during the month. As a result of these questions, a Spanish bank had to abort a bond sale and trading was halted in several Italian banks.
The renewed risk in the European banking sector is negative for the euro and positive for the dollar, yen and gold.
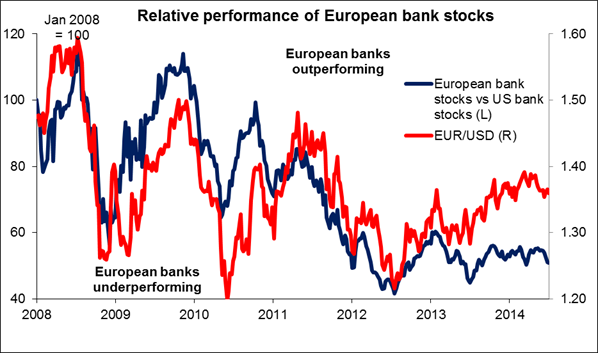
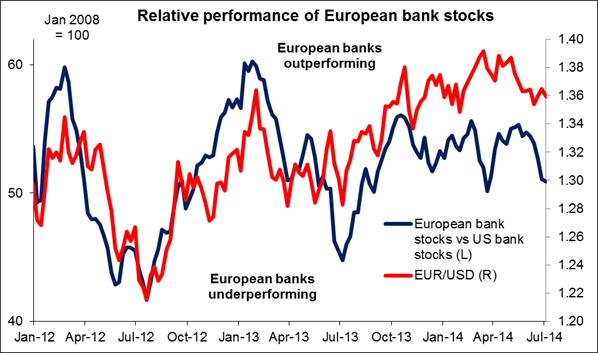
The graphs below show the close correlation between the relative performance of European and US stocks and EUR/USD. The graph on the left suggests that the correlation broke down from 2013, but the graph on the right shows that this is largely a matter of scale – in fact the correlation remained fairly close until this year. Generally when European bank stocks (MSCI European Banks index) outperform US bank stocks (MSCI US Banks index), EUR/USD tends to move up, and visa-versa. With the health of the European banking industry now coming into focus again, this could push EUR/USD down further.
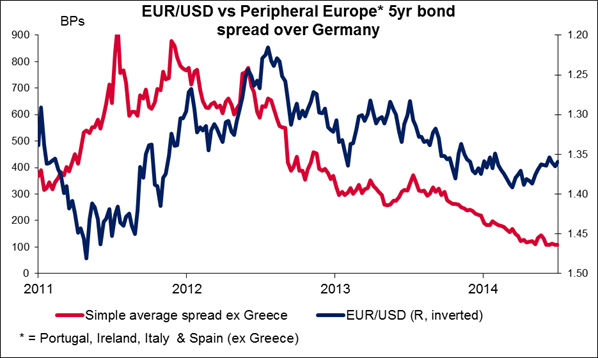
As the third graph shows, the euro has also generally tracked the spread of peripheral bonds over German bonds, a measure of the risk premium that investors require to hold peripheral debt. A decline in that risk premium has been associated with greater confidence in the euro and therefore a rise in the currency’s value. It’s reasonable that as nervousness about the banking system comes back, this spread should widen out again and EUR/USD should move lower as a result.
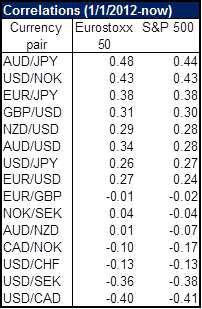
The yen also tends to benefit during risk-off periods. In particular, it tends to appreciate against the dollar when Tokyo stock prices go down. On the other hand, USD/JPY is not as sensitive to movements in European or US stocks as it is to movements in Japanese stocks. Looking at the former two markets, AUD/JPY has the highest correlation of the major currency pairs to the Eurostoxx 50 index and to the S&P 500 index, so selling that pair that could be an efficient way to play the sell-off in stocks in the FX market. NOK tends to gain vs USD NOK/USD when stocks are falling while CAD tends to weaken, but CAD/NOK is not highly correlated with stocks. USD/CAD’s negative correlation agrees with my positive fundamental view on the currency pair.
As for Gold, it still retains its safe-haven status, as shown by its rallies during the EM sell-off, the Ukraine crisis, and the periodic flare-ups in the Middle East. I would expect gold to continue to gain on this news. The technical picture for gold is now favourable (see technical section below).
Other news: I said yesterday that I thought what was going to move EUR/USD out of its range would be action by the Fed. Eurozone banking crises aside, it probably isn’t going to be action by the ECB. Yesterday ECB Governing Council member Ewald Nowotny said he does “not see a need for further action in the near future, at least not in the field of monetary policy.” He added that he was “strictly against this attitude that the ECB should show a new trick at every meeting.” So with the ECB on hold, Eurozone economic indicators are also likely to be of only secondary importance to the market. The exception would be any data that would lower investors’ inflation expectations, which could force the ECB to act.
Yesterday’s speech by Fed Vice Chair Stanley Fischer was a non-event for the market as he spoke on financial stability and did not touch on the economy or monetary policy. St. Louis Fed President Bullard was more relevant. He said the rapid fall in unemployment was likely to make the economy overshoot the Fed’s inflation target, bolstering his case for a rise in interest rates early next year. However he admitted that his view is different from the rest of the FOMC.
Today: Final CPI data for June from Germany and Spain are due. As usual, the forecast is the same as the initial estimate. From the UK, the construction output for May is expected to slow on a mom basis.
On the other side of Atlantic, Canada’s unemployment rate for June is expected to remain at 7.0%, while the net change in employment is forecast to decrease to 20.0k from 25.8k.
Today we have three Fed speakers scheduled. Atlanta Fed President Dennis Lockhart, Chicago Fed President Charles Evans and Philadelphia Fed Presidents Charles Plosser speak at the Rocky Mountain Economic Summit.
The Market
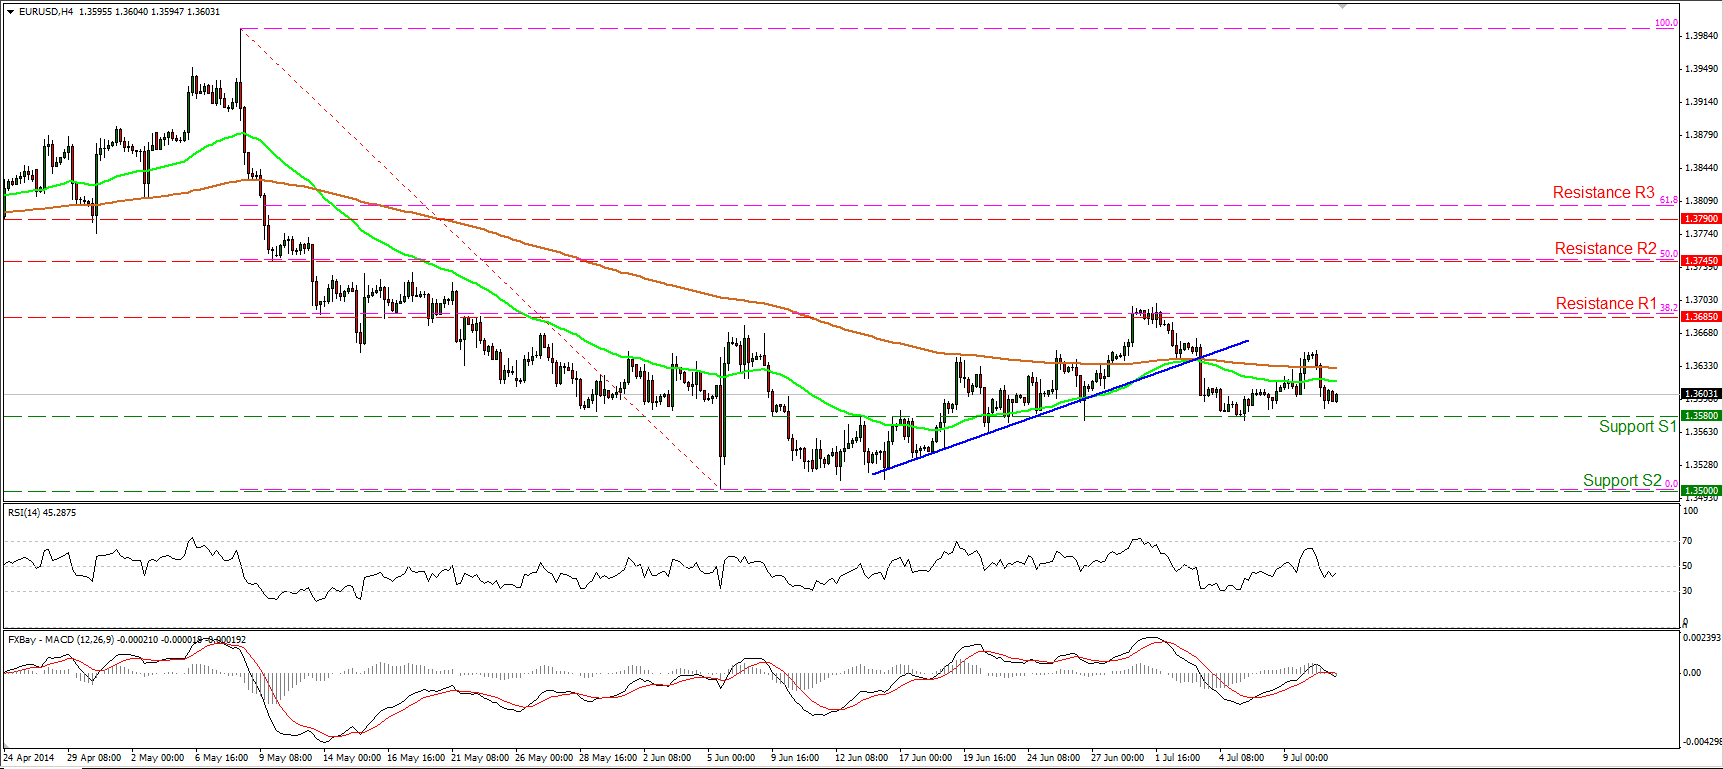
EUR/USD back near 1.3580 support
EUR/USD declined on Thursday after printing a lower high and is back near the support zone of 1.3580 (S1). Considering that both the 50- and the 200-period moving averages are pointing sideways, I would maintain my neutral stance. Only a dip below the 1.3580 (S1) could confirm a forthcoming lower low and trigger further bearish extensions. I would expect such a dip to pave the way towards the psychological barrier of 1.3500 (S2). On the daily chart, both the 14-day RSI and the daily MACD lie near their neutral levels, corroborating my flat view, at least for now.
• Support: 1.3580 (S1), 1.3500 (S2), 1.3475 (S3).
• Resistance: 1.3685 (R1), 1.3745 (R2), 1.3790 (R3).
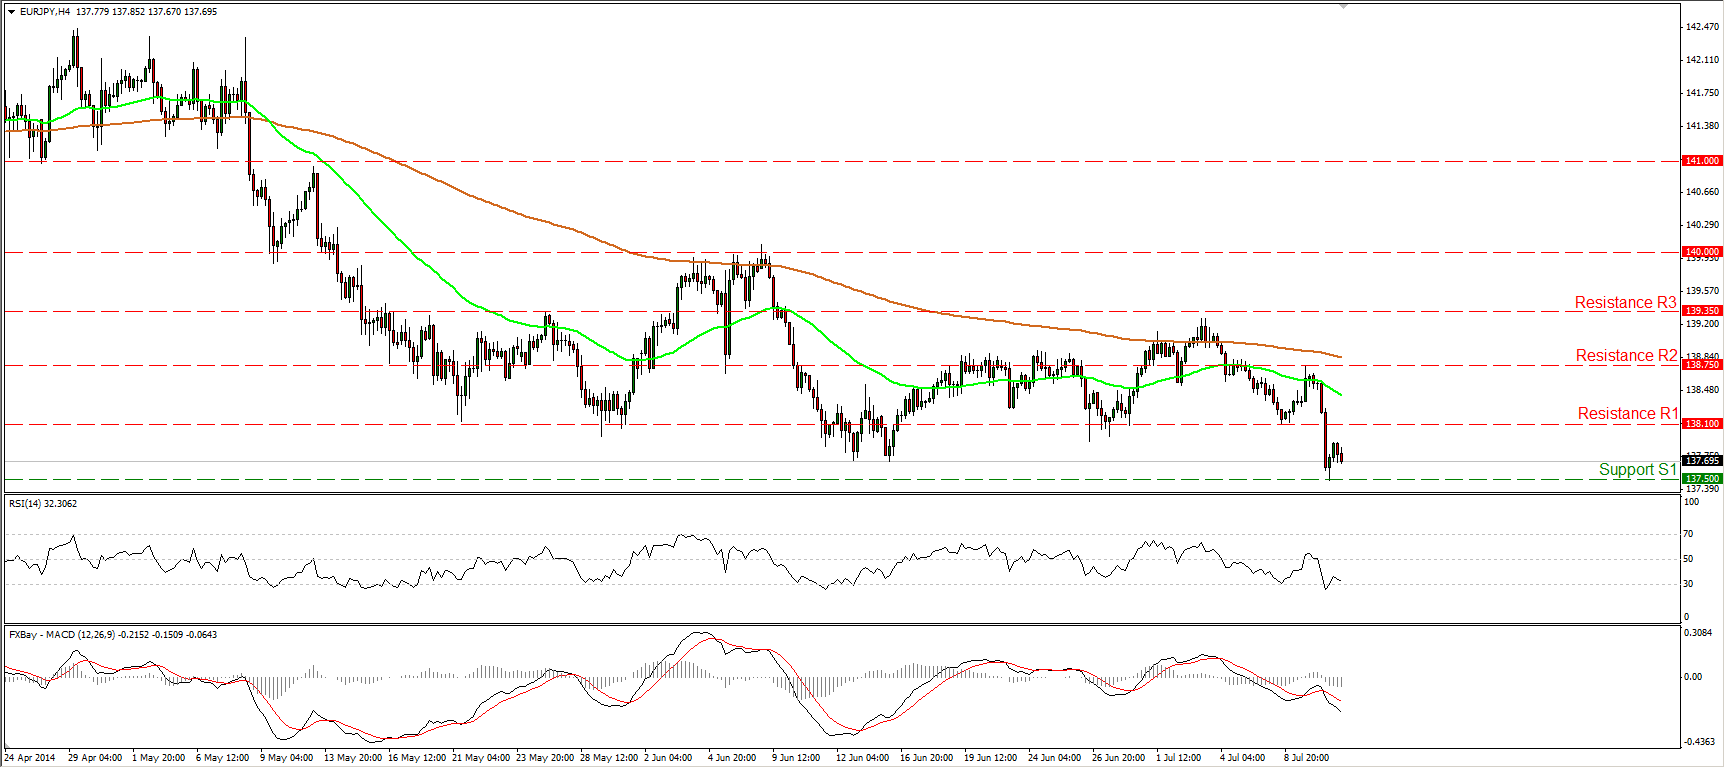
EUR/JPY falls below 138.00
EUR/JPY plunged yesterday, falling below the 138.10 barrier and finding support at 137.50 (S1). The rate rebounded somewhat from the latter bar but at the time of writing is moving lower and seems ready to challenge it once again. A decisive move below the 137.50 (S1) support could pave the way towards the next support hurdle, at 136.75 (S2). The MACD, already within its negative territory, fell below its signal line, confirming yesterday’s downside momentum. The rate remains below both the moving averages, with the 50-period one shifting to the downside. Thus, the short-term outlook remains mildly to the downside, in my view.
• Support: 137.50 (S1), 136.75 (S2), 136.20 (S3).
• Resistance: 138.10 (R1), 138.75 (R2), 139.35 (R3).
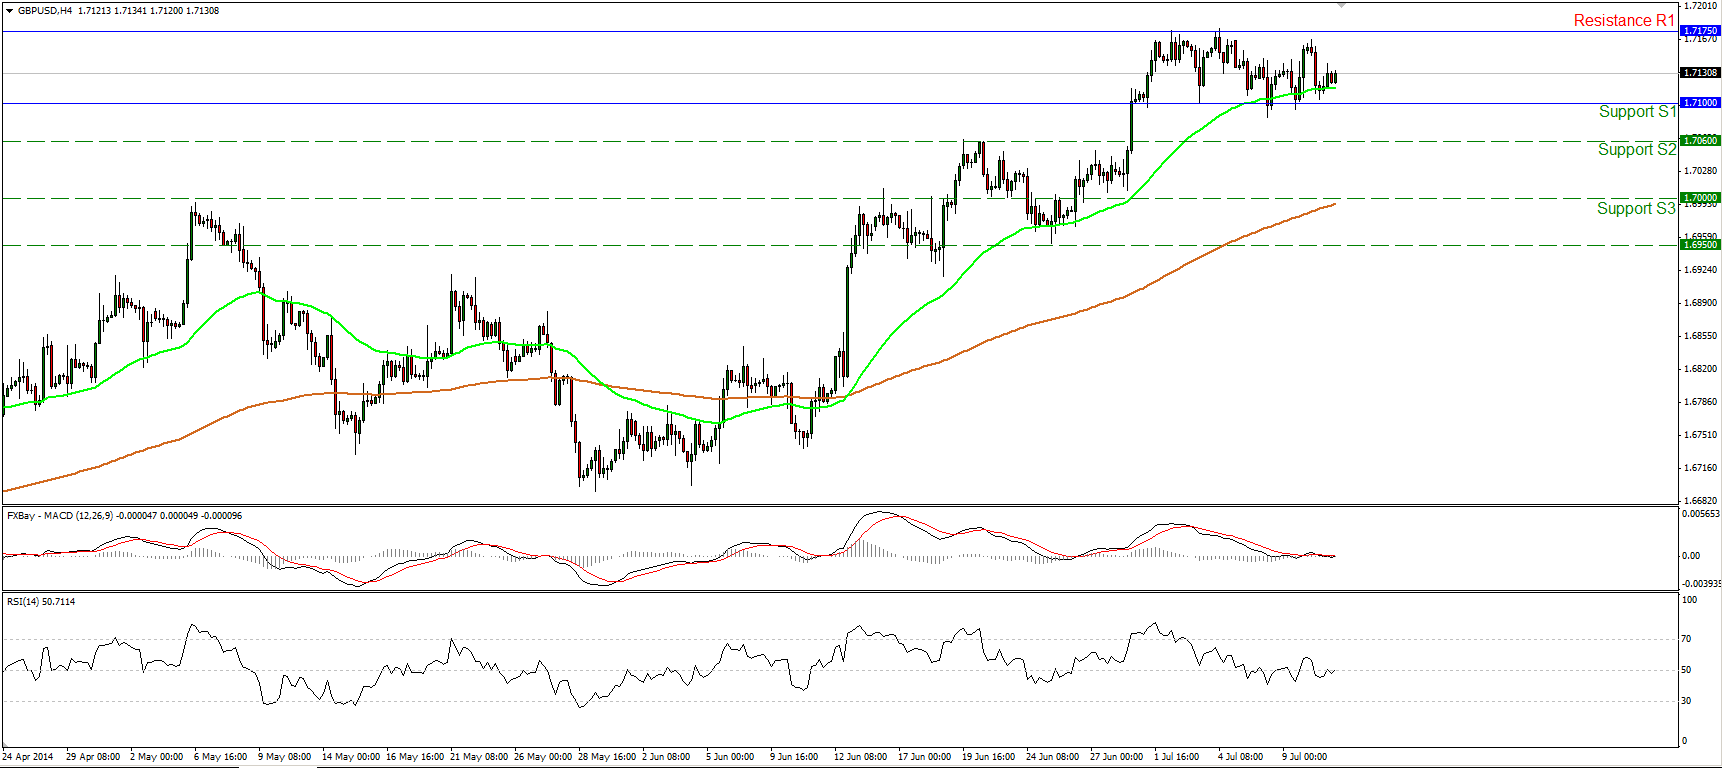
GBP/USD remains neutral
GBP/USD moved lower but the decline was halted slightly above the 1.7100 (S1) zone. I would remain flat, since the rate has been trading between that support and the resistance of 1.7175 (R1) since the 30th of June. Both our momentum indicators lie near their neutral levels, confirming the trendless mode of cable. A move above the 1.7175 (R1) hurdle would confirm a forthcoming higher high and signal the continuation of the uptrend, while a dip below the 1.7100 (S1) zone could trigger further correction. In the bigger picture, the 80-day exponential moving average provides reliable support to the lows of the price action, keeping the long-term path to the upside. As a result, I would consider any future declines as a correction phase of the longer-term uptrend.
• Support: 1.7100 (S1), 1.7060 (S2), 1.7000 (S3).
• Resistance: 1.7175 (R1), 1.7200 (R2), 1.7300 (R3).
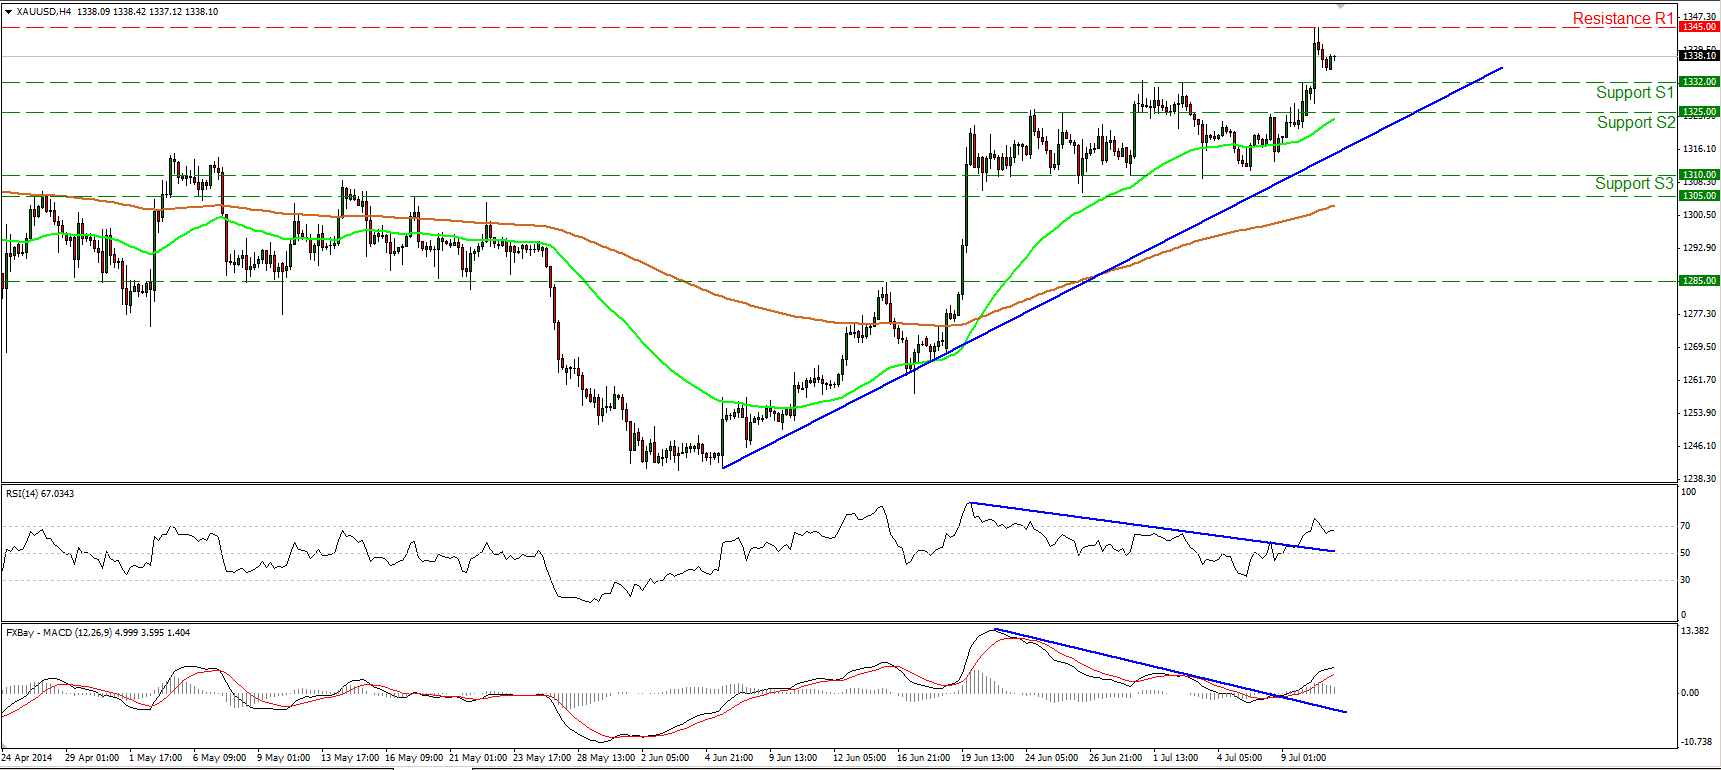
Gold confirms the bullish trend
Gold moved significantly higher yesterday, breaking above the recent highs of 1332 and finding resistance at 1345 (R1). The move confirms a higher high and confirms the positive picture of the precious metal. As long as the price is trading above the blue uptrend line and above both the moving averages, the bias remains to the upside. A decisive break of the 1345 (R1) hurdle could target the next resistance at 1355 (R2). On the daily chart, gold remains above the 200-day moving average, while the 50-day moving average seems ready to cross above the 200-day moving average in the near future. This increases the likelihood for the continuation of the uptrend.
• Support: 1332 (S1), 1325 (S2), 1310 (S3) .
• Resistance: 1345 (R1), 1355 (R2), 1365 (R3).
WTI rebounds from the 101.70 zone
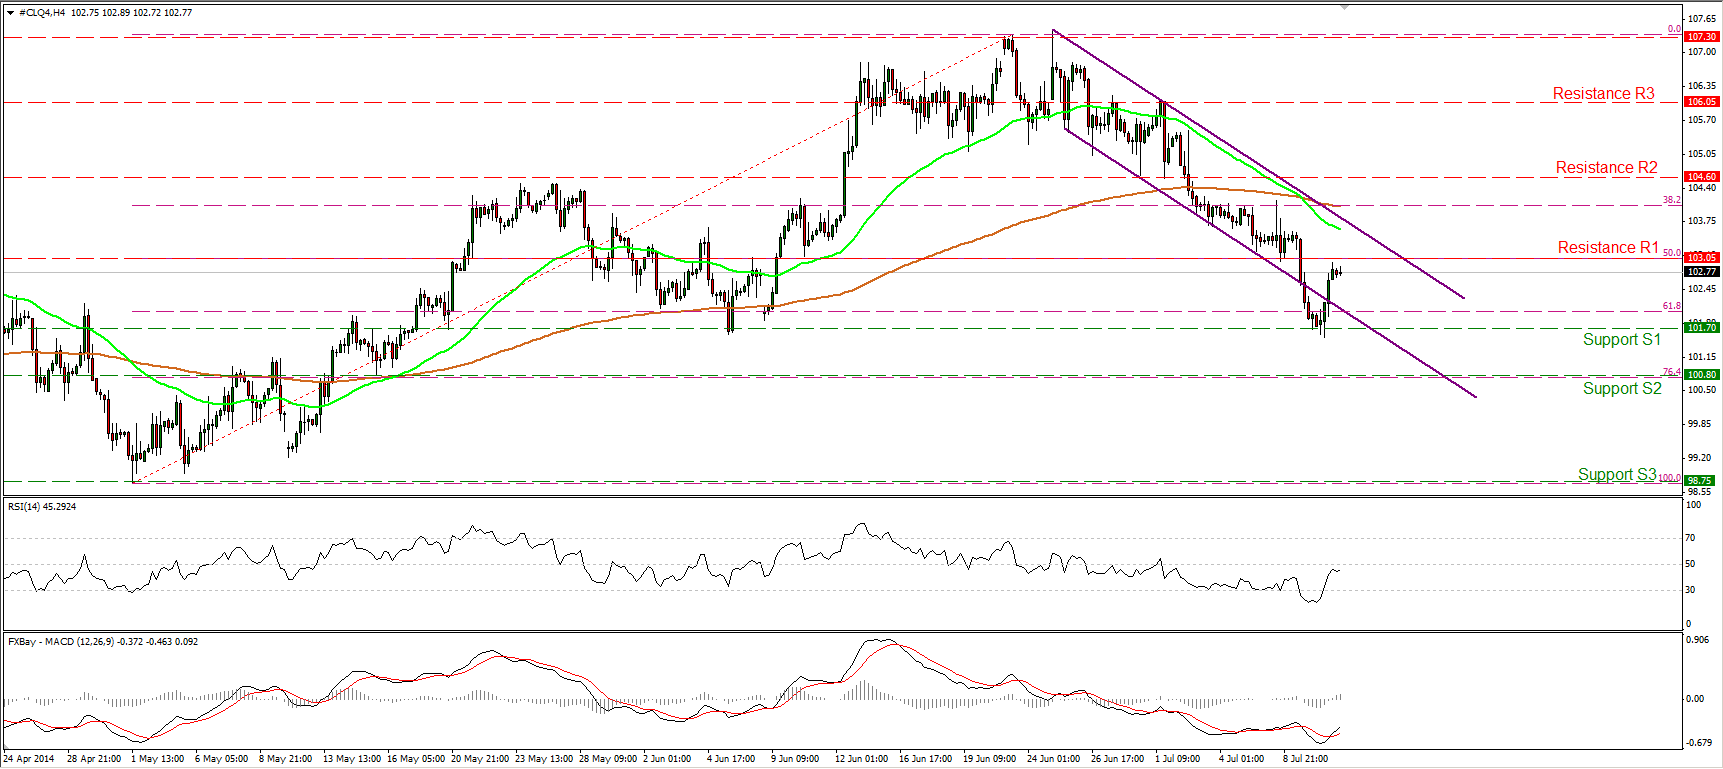
WTI edged higher yesterday after finding support at 101.70 (S1), slightly below the 61.8% retracement level of the May 1st – June 23rd advance. Having in mind that the price is back within the purple downward sloping channel and that the possibility for a lower high still exist, I would consider the downside path to remain intact and yesterday’s advance as a corrective wave before the bears take control again. A clear break below 101.70 (S1) could target the 76.4% retracement level of the May 1st – June 23rd advance, at 100.80 (S2). On the upside, only a decisive move above the upper boundary of the downside channel would be a reason to reconsider our analysis.
• Support: 101.70 (S1), 100.80 (S2), 98.75 (S3).
• Resistance: 103.05 (R1), 104.60 (R2), 106.05 (R3).

