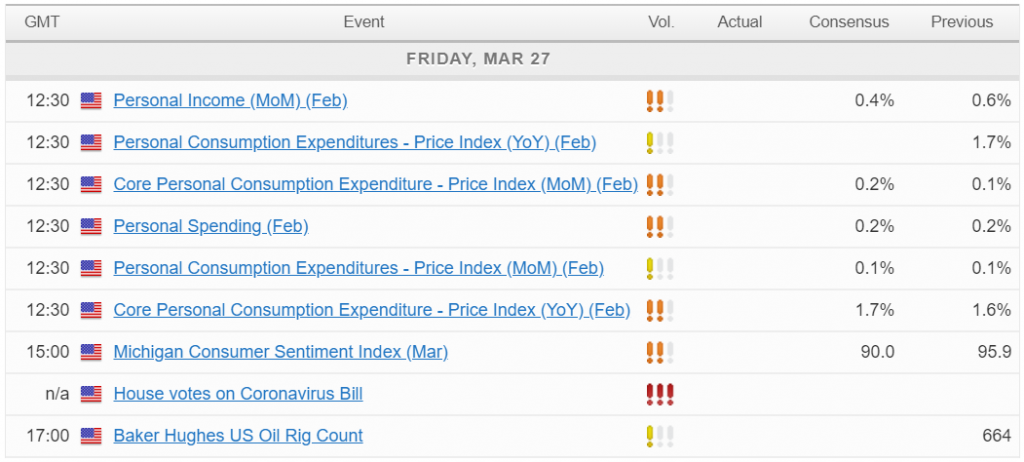
Fun while it lasted
Rallies don’t last forever and clearly investors are happy to call time on this one as we head into another uncertain weekend.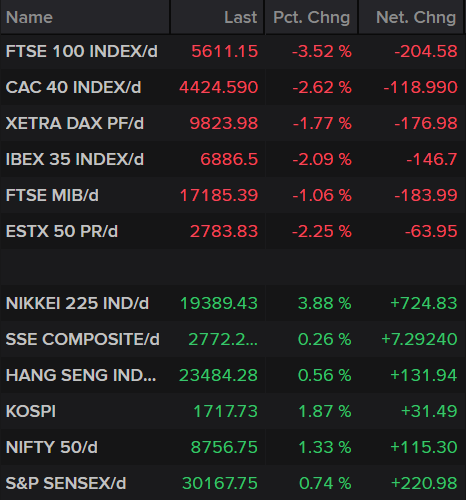
The last three Monday’s have all been relatively heavy down days, producing an average decline of 5.16% in the FTSE 100. We may have had a good run this week but the weekend can feel like a long time at moments like this and the numbers were getting from the US, which now has more cases than China or Italy, are getting uglier by the day.
It therefore strikes me as quite sensible to take some profit off the table and see how the weekend goes. I fear a few more shocks lie ahead as we get closer to peak coronavirus in countries like the US, UK and more.
Various support measures from governments and central banks around the world, with the huge packages in the US this week alone, are helping to alleviate investor concerns but they don’t change the fact that we still don’t know how ugly the situation is going to get or how bad and long the economy will suffer.
Needless to say, this week has been welcome after a month of extreme turbulence in the markets. But yesterday’s huge record spike in jobless claims to more than three million is among the first of many ugly data points to come. Investors may have given it a free pass yesterday, still buoyed by the prospect of multi-trillion dollar stimulus packages, but will that last? I’m not convinced.
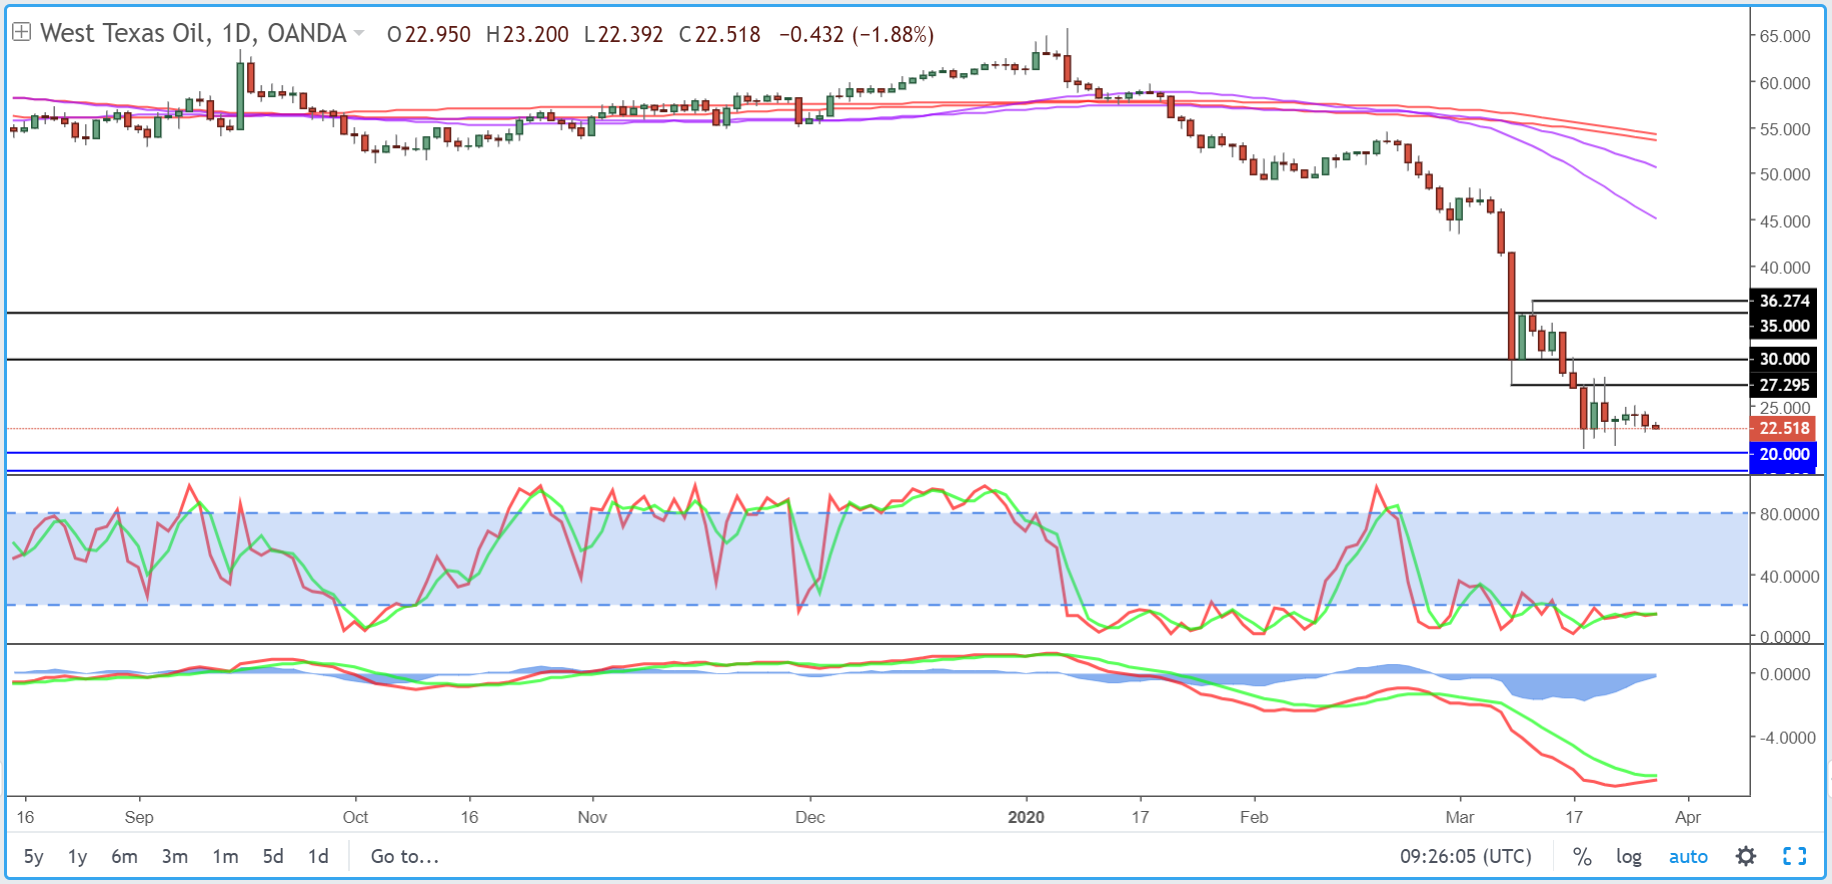
Oil remains vulnerable to $20 break
This week has provided some welcome reprieve for oil prices, although even now they’re not trading too far off the lows. Even stabilization though is welcome after an extraordinary period, with the impending global recession being compounded by the oil price war to smash prices to bits.
The sell-off may have slowed but there’s still a lot of vulnerability to the downside and while $20 may have provided support so far for WTI, I wonder whether that will continue to be the case in the coming weeks.
WTI Daily Chart
Gold remains buoyed after Fed action
Gold is holding onto its recent gains after rebounding strongly earlier this week as the Federal Reserve announced its unlimited, open-ended, quantitative easing program. That, combined with other measures, eased the upside pressure on the dollar and saw it pull back around 4%, aiding the rally in gold back to levels you would expect to see in times like this. It’s still seeing resistance around $1,640 but as long as we don’t see any more sharp shocks in equity markets, this will likely come under much more pressure.
Gold Daily Chart
Bitcoin rally running out of steam
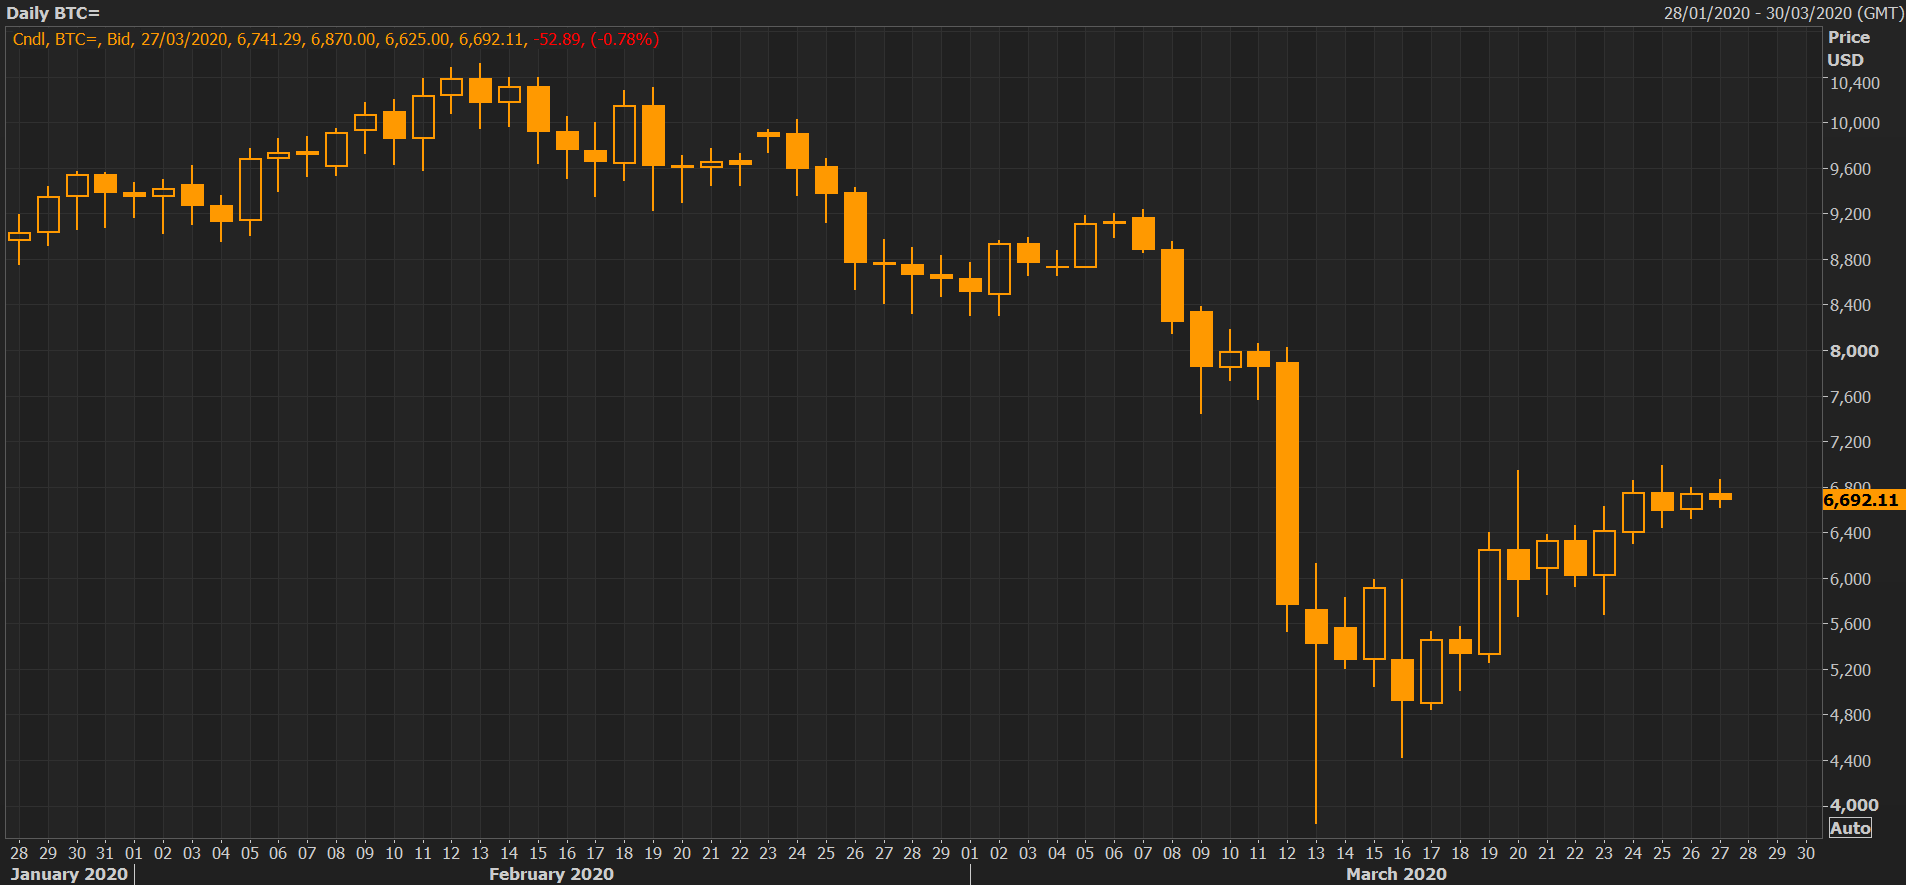
Not a lot has changed as far as bitcoin is concerned over the last few days. It is continuing to trend higher but momentum has been dropping as it faces difficulty around $7,000. The improvement in general sentiment in the market appears to be supporting moves in cryptos but that may change. A break of $7,000 could be the catalyst for more sharp rallies but it could still see some resistance around $7,500.
Bitcoin Daily Chart
Economic Calendar
