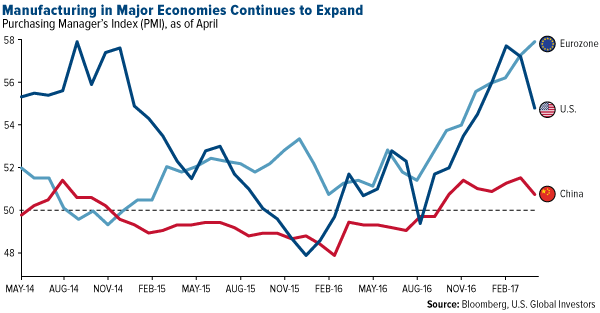
At the start of the second quarter, the eurozone’s manufacturing sector grew at its fastest pace in six years, climbing from 56.2 in March to 56.7 in April and marking the eighth straight month of expansion. Of the eight eurozone countries that IHS Markit surveys, only Greece failed to show any improvement during the month.
Growth was spurred by new orders, output and job creation, and companies are benefiting from both the historically weak euro and the European Central Bank’s ongoing stimulus, including low interest rates. Factory jobs are currently seeing one of their strongest upticks in the survey’s 20-year history.
Ahead of France’s presidential election this past weekend—polls heavily favored the victor, 39-year-old Emmanuel Macron, over far-right candidate Marine Le Pen—the country showed impressive momentum, rising from 53.3 in March to 55.1 in April. New orders grew at their sharpest pace in six years. Meanwhile, the United Kingdom’s manufacturing sector continued to expand post-Brexit, rising to a three-year high of 57.3.
Both the U.S. and China continued to expand at the start of the second quarter, though at a slightly slower pace than in March. U.S. manufacturing growth relaxed a little more than 2 percent, from 57.2 to 54.8, but it still remains at a high level in the six months following the presidential election. Chinese factories pumped the brakes in April, with growth slowing to a seven-month low.
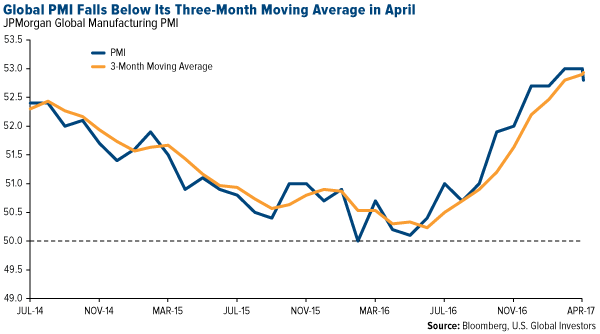
Manufacturing on a global level continued to expand as well but, like the U.S. and China, at a slower pace. The index fell from 53 in March to 52.8 in April, with the one-month reading falling below its three-month moving average for the first time since April of last year.
Like clockwork, copper and oil were off last week. As I’ve shown a number of times before, PMI can be used as a forecast tool for commodities and natural resource prices.
Last Wednesday, copper lost 3.5 percent, marking the largest single-day loss since September 2015. The red metal ended the week at $2.53 a pound. Oil tumbled nearly 5 percent on Thursday to close the trading day at $45.48, a level we haven’t seen since December. On Friday it finished above $46 a barrel.
Disclosure: All opinions expressed and data provided are subject to change without notice. Some of these opinions may not be appropriate to every investor. This commentary should not be considered a solicitation or offering of any investment product. Certain materials in this commentary may contain dated information. The information provided was current at the time of publication.


