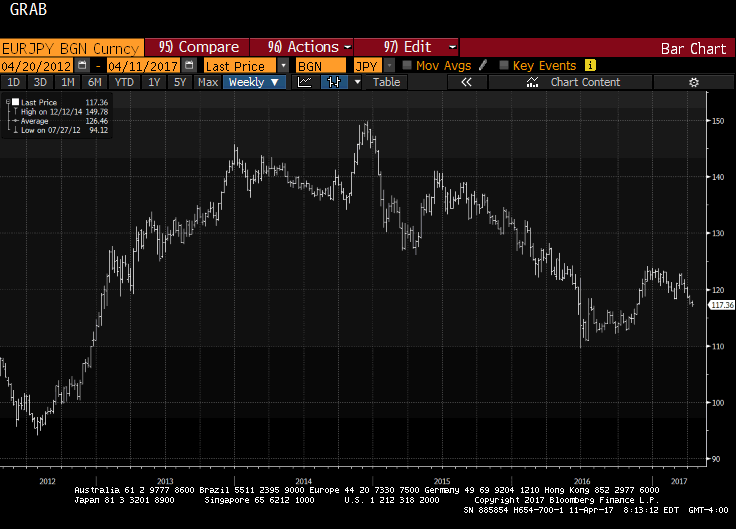
Looking for a trend in the foreign exchange market? The euro was weaker against the yen for the 11th consecutive session yesterday, which is the longest streak in the euro's natural life. Since March 17, the euro has only risen twice against the yen.

As this Great Graphic from Bloomberg illustrates, the euro has been trending lower since last 2014. It staged a counter-trend rally in Q4 last year. That advance faltered near the 38.2% retracement of the decline from 2014. The retracement objective was a little below JPY125 and the euro peaked at the end of 2016 a little above JPY124.00.
In some ways, the euro-yen cross may express geopolitical axis. The anxiety ahead of the French presidential election, the US missile strike in Syria, and heightened tensions on the Korean peninsula all seem to favor the yen. The French election and widening premium that is being demanded of the French is seen as broadly euro negative.
Although there is much of that narrative that makes intuitive sense, the problem is the timing. The pressure on the euro-yen cross pre-dates the heightened political concerns. We suspect that interest rate developments are more important than geopolitics in explaining euro-yen movement.
The 60-day rolling correlation between the percent change in the euro-yen exchange rate and the US 10-year yield is near 0.55, the upper end of the three-year range. The correlation of the 2-year US yield and the cross is a little above 0.50, and is also near the strongest it has been since the peaked in mid-2014. We tested other possible explanatory variables, like the S&P 500 (0.32, mid-range), oil (-0.40, lower end of the range), and gold (-0.36, a little below the middle of the three-year range).
The correlation between the German-French 10-year spread and the euro-yen exchange rate is near -0.44, which near the most extreme since 2014. We dug a little deeper, after all, previously, Japanese investors were significant buyers of French bonds. Maybe there is something there. However, we found that the correlation between 10-year French bond yields and the euro-yen was at 0.20, which is below the midpoint of the three-year range. On the other hand, the correlation of the euro-yen cross and the 10-year German bund is over 0.62, and is near the highest it has been since 2012.
The technical indicators suggest the market is stretched, which is what one would expect given the streak and the 5% slide since the day before the Fed hiked on March 15. That said, the cross is just inside the Bollinger® Band and while the MACDs and Slow Stochastics are leveling out, neither has turned higher. The JPY116.85 area, which was approached yesterday, is the 50% retracement of the rally off the Brexit-inspired lows (~JPY109.60). The 61.8% retracement is near JPY115.10. The cross has been chopping back and forth over the 200-day moving average in recent sessions. It was found near JPY117.80 as of this writing. Yesterday may have been the first session since last November that the cross did not spend at least part of the session above that average.
