EUR/AUD Overview
Weekly Chart: The trend is still bullish. Price is above all main EMAs. However, it is in the lower Bollinger Bands®. Further decline is predicted.
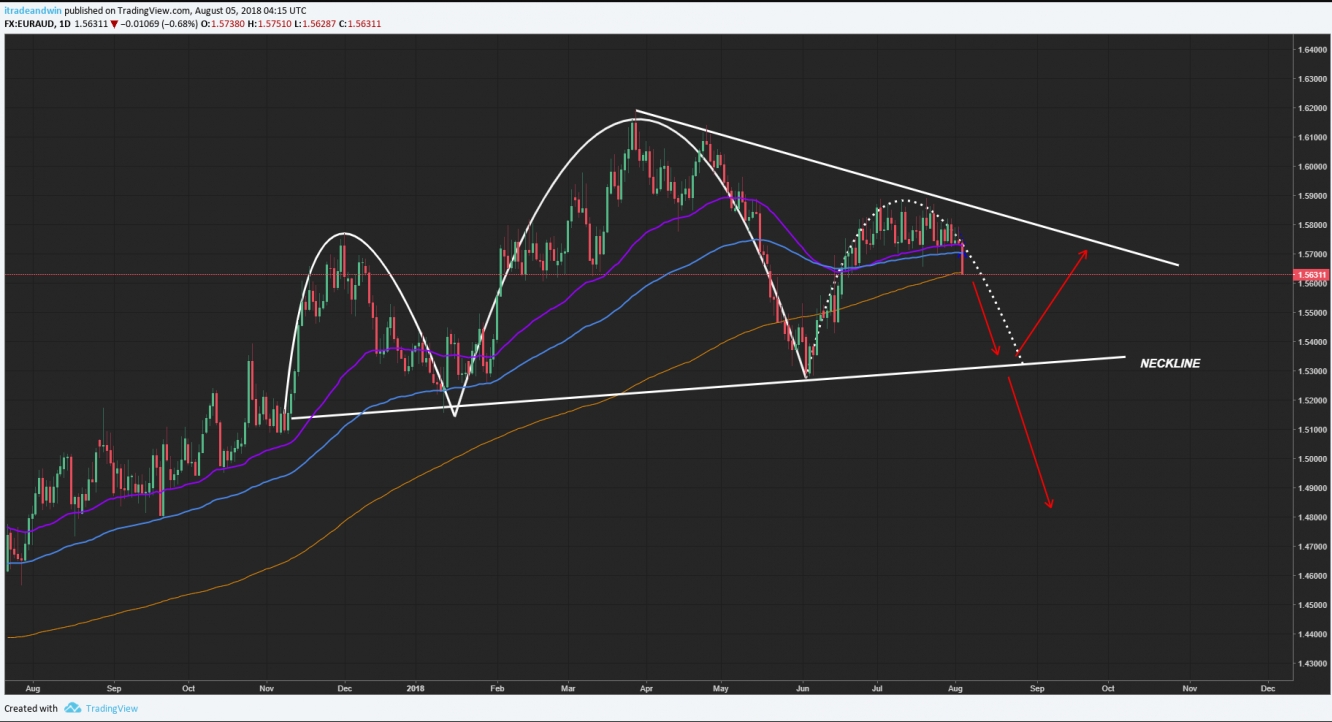
Daily Chart: EUR/AUD ended the week at 1.56300 where it meets the SMA 200 support. Price is below EMA 50 and EMA 100. RSI has more rooms downside. The Pair is forming a Head and Shoulders pattern. Strongly possible to test the neckline. ( 1.53200 – 1.53000 )
Four Hours Chart: Strongly Bearish. Golden Cross is completed.
Fundamentals of the week: RBA will make its rate decision on Tuesday. It is not expected to make any changes, so the interest rates in Australia is likely to remain at 1.5%. But the Aussie will move up if RBA leaves its dovish view. Latest quarterly GDP and employment figures may make RBA a bit more Hawkish.
Conclusion: It is the selling time as long as the pair holds below 1.58000
Possible Pullback Levels to sell: 1.56800 1.57200
Downside levels for minor corrections: 1.55940 1.55640
This analysis prepared by the global analysts of Chartreaderpro.com and published on Investing.com. Commercial distribution is strictly prohibited.

