Who is Kevin Hassett? Wolfe looks at the Trump ally tipped to become Fed Chair.
EUR/USD
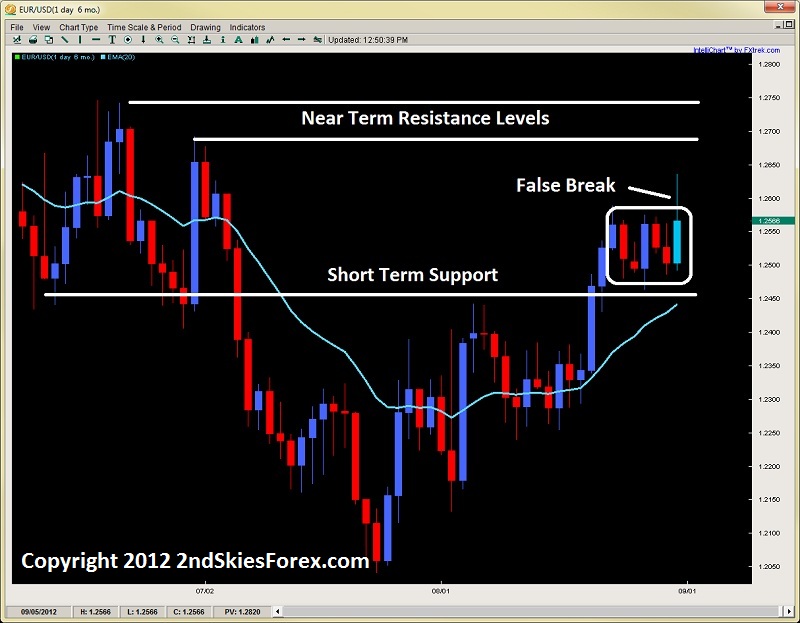
Although the pair gained on Friday to close the week, the pair formed a false break being unable to close above the weekly consolidation. The rejection from the false break is almost 50% of the entire price action for the day, communicating a healthy amount of sellers (yet not enough to dominate the day). I still think there are buyers willing to take another shot at the upside, but there are several levels they will have to contend with. Such as:
a) 1.2636 (Friday’s high at January's swing low)
b) 1.2688 June 29th Spike High
c) 1.2739 June Monthly Highs
Sellers can look to park shorts around these levels targeting a pullback to 1.2500 while bulls would be likely more served taking pullbacks to the 1.25-.2450 area before bringing in new longs.
 EUR/USD" title="EUR/USD" width="728" height="563">
AUD/USD
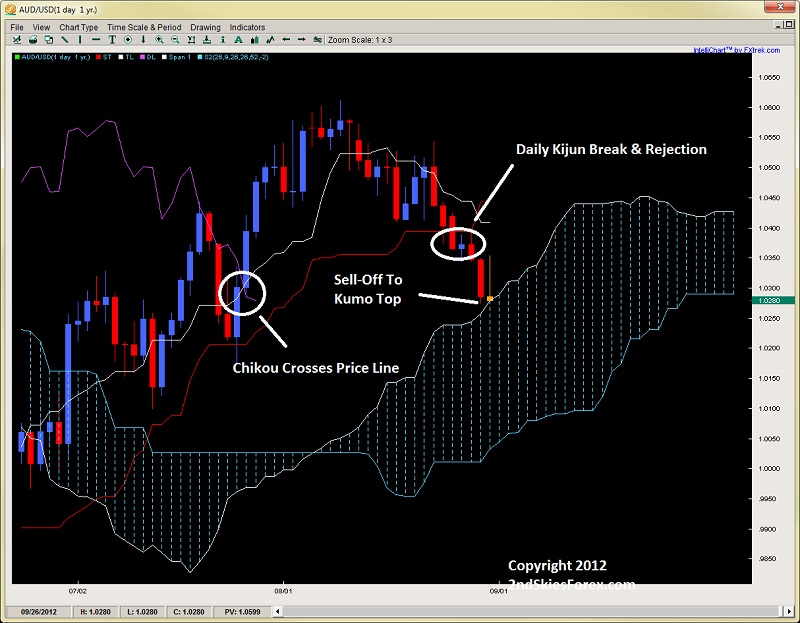
Last week I wrote about the Aussie breaking the Kijun-Sen for the first time on the daily charts suggesting short term bearish momentum should take over and this is exactly what happened. The pair then sold off 3 of the next 4 days while even rejecting off the Kijun. The pair went right to the daily kumo as anticipated and in the process formed an inverted pin bar.
Currently the Chikou Span has crossed the price line and the tenkan-sen which also adds bearish pressure from an ichimoku perspective. Unless the pair gets bought up aggressively from here, pullbacks to the tenkan and 1.0345 can be used for intraday shorts. Bulls meanwhile have the current kumo top and 1.0224 levels as support, but a daily close in the kumo will add more chips to the bearish stack.
 AUD/USD" title="AUD/USD" width="728" height="563">
Gold
After pulling back for most of last week due to position paring ahead of the Jackson Hole meeting, gold showed its real colors as it formed a with trend bullish engulfing bar which was over $45 from top to bottom. This was mostly in response to the gold bulls believing more monetary easing is in the pipeline. Now that the metal has held the breakout from two weeks ago, I’m expecting the precious metal to make higher levels for most of September.
Remember there are massive paper shorts on the metal which likely covered on the breakout from two weeks ago. Then last weeks $40 gain on the week surely forced more to cover. With there being huge amounts of paper shorts, we could see more violent upside moves like Friday as the shorts continue to get squeezed out of the market.
Short-term bulls can take longs on pullbacks towards $1673 and $1651 if it somehow gets there (unlikely next week). I am continuing to hold my longs at $1633 and will keep accumulating positions on pullbacks gunning for a minimum target of $1900 (likely before year end).

Silver
Also following gold, silver formed a pin bar rejection last week which I wrote about is unlikely to hold the upside. The metal gained huge to end last week almost forming a bullish engulfing bar (minus the low below prior days low). Regardless, bulls are now in the driver seat. Short-term bulls can look for pullbacks to $31 and $30.42 while bears will want to wait for $32.43 and a strong price action rejection around these levels before considering shorts.

Original post
Although the pair gained on Friday to close the week, the pair formed a false break being unable to close above the weekly consolidation. The rejection from the false break is almost 50% of the entire price action for the day, communicating a healthy amount of sellers (yet not enough to dominate the day). I still think there are buyers willing to take another shot at the upside, but there are several levels they will have to contend with. Such as:
a) 1.2636 (Friday’s high at January's swing low)
b) 1.2688 June 29th Spike High
c) 1.2739 June Monthly Highs
Sellers can look to park shorts around these levels targeting a pullback to 1.2500 while bulls would be likely more served taking pullbacks to the 1.25-.2450 area before bringing in new longs.
EUR/USD" title="EUR/USD" width="728" height="563">AUD/USD
Last week I wrote about the Aussie breaking the Kijun-Sen for the first time on the daily charts suggesting short term bearish momentum should take over and this is exactly what happened. The pair then sold off 3 of the next 4 days while even rejecting off the Kijun. The pair went right to the daily kumo as anticipated and in the process formed an inverted pin bar.
Currently the Chikou Span has crossed the price line and the tenkan-sen which also adds bearish pressure from an ichimoku perspective. Unless the pair gets bought up aggressively from here, pullbacks to the tenkan and 1.0345 can be used for intraday shorts. Bulls meanwhile have the current kumo top and 1.0224 levels as support, but a daily close in the kumo will add more chips to the bearish stack.
AUD/USD" title="AUD/USD" width="728" height="563">Gold
After pulling back for most of last week due to position paring ahead of the Jackson Hole meeting, gold showed its real colors as it formed a with trend bullish engulfing bar which was over $45 from top to bottom. This was mostly in response to the gold bulls believing more monetary easing is in the pipeline. Now that the metal has held the breakout from two weeks ago, I’m expecting the precious metal to make higher levels for most of September.
Remember there are massive paper shorts on the metal which likely covered on the breakout from two weeks ago. Then last weeks $40 gain on the week surely forced more to cover. With there being huge amounts of paper shorts, we could see more violent upside moves like Friday as the shorts continue to get squeezed out of the market.
Short-term bulls can take longs on pullbacks towards $1673 and $1651 if it somehow gets there (unlikely next week). I am continuing to hold my longs at $1633 and will keep accumulating positions on pullbacks gunning for a minimum target of $1900 (likely before year end).
Silver
Also following gold, silver formed a pin bar rejection last week which I wrote about is unlikely to hold the upside. The metal gained huge to end last week almost forming a bullish engulfing bar (minus the low below prior days low). Regardless, bulls are now in the driver seat. Short-term bulls can look for pullbacks to $31 and $30.42 while bears will want to wait for $32.43 and a strong price action rejection around these levels before considering shorts.
Original post