
In terms of relevant news to account for, the last 24h should be defined as a low key affair, which is why I will afford to take a step back and look at the big picture for April
Quick Take
In terms of relevant news to account for, the last 24h should be defined as a low key affair, which is why I will afford to take a step back and look at the big picture for April. After all the chat about the Euro being fundamentally weak, which is a reality I agree on, the market is not yet convinced that the currency deserves to be overly supplied even if the ECB remains firmly dovish and ready to go through another round of TLTRO mid this year. The net effect, however, considering the rest of Central Banks are headed in the same dovish direction, is a market that lacks the incentives to develop macro trends and its volatility is a reflection of it, with carry trade back in vogue.
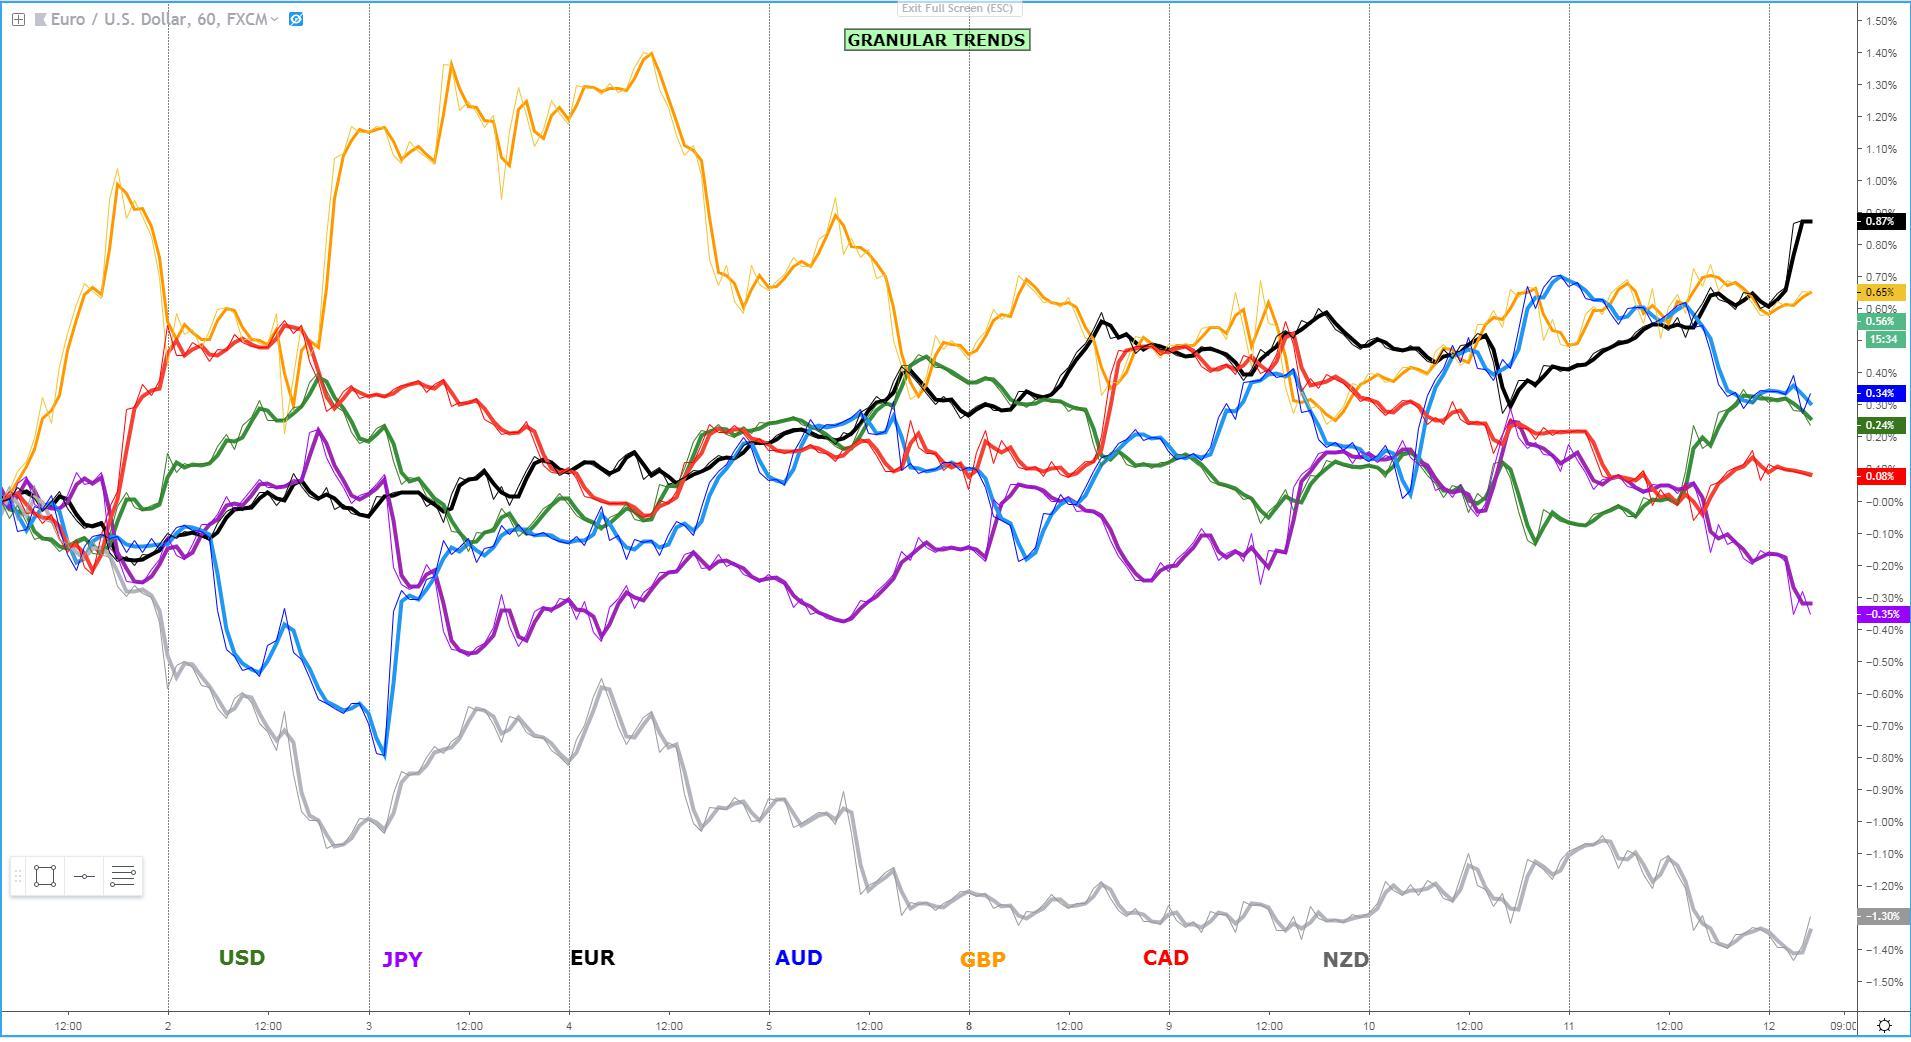
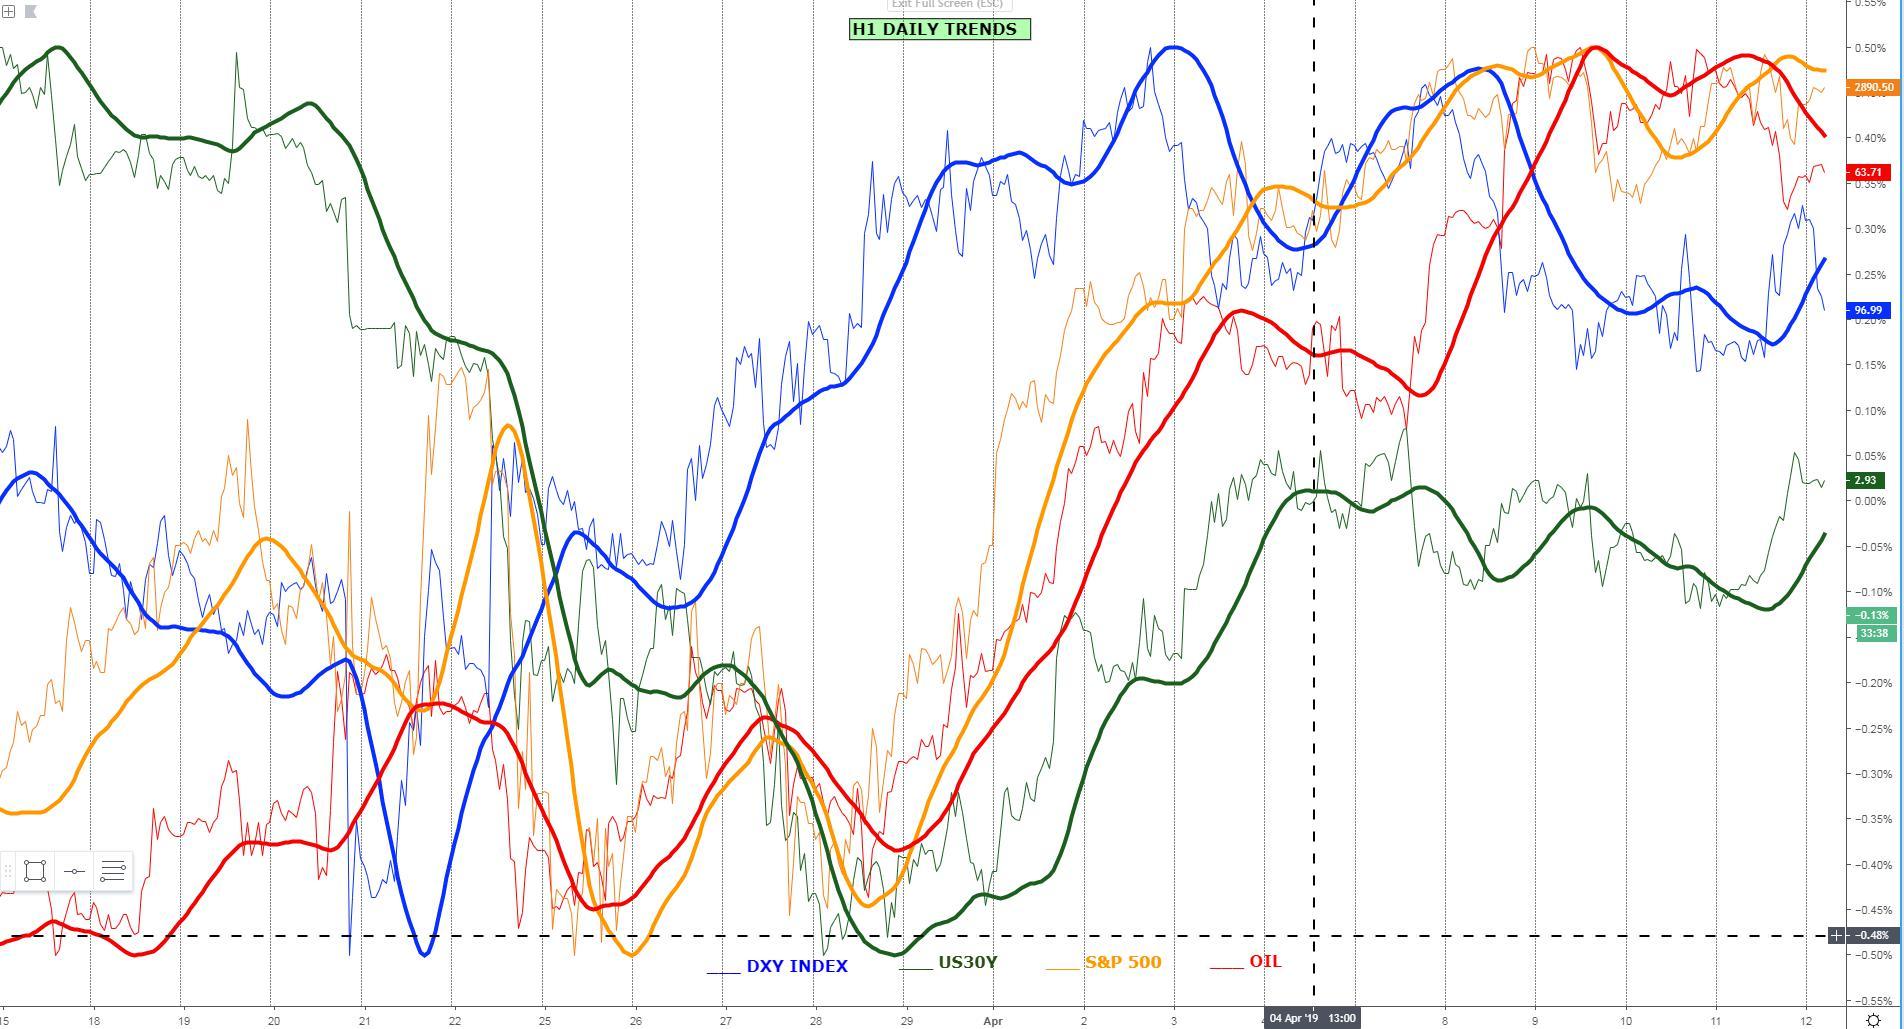
The performance of G8 FX through the first 2 weeks of April is the proof in the pudding if you were wondering the true rotational nature of these markets. It makes the interpretation of intermarket flows, especially episodes of 'risk on & risk off' to gauge the direction of the AUD, CAD, NZD, JPY, USD all more important, while the GBP keeps trading to the tune of its own drummers (Brexit-related news) & the EUR accurately respecting technicals. The depreciation by the NZD and the trends that have developed as a result of the dovish surprise by the RBNZ earlier this month encourages us to think that once Central Bank policy divergences become a bigger theme in the future, trends will return, even if we shouldn't hold our breath but instead adapt to the present circumstances.
One really needs to contend with the diminutive moves witnessed day-to-day by being much more nimble to take profits, be aware of the relevances that proj target has in such a multi-year low environment and get better at deconstructing the granular directional biases still developing intraday. As the chart below shows, long EURs or USDs against the likes of the Japanese Yen have paid off handsomely in the last 24h, which judging by the RORO conditionsI analyze every day, you were definitely warned.
Recent Economic Indicators & Events Ahead
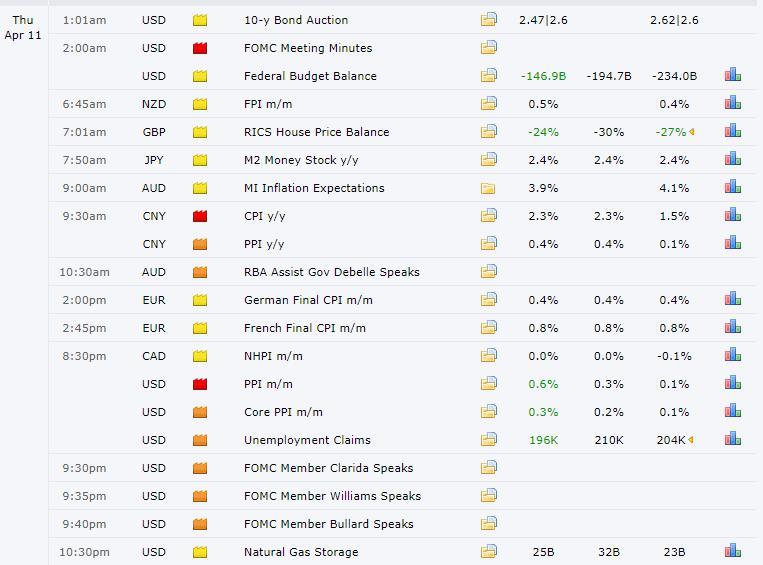
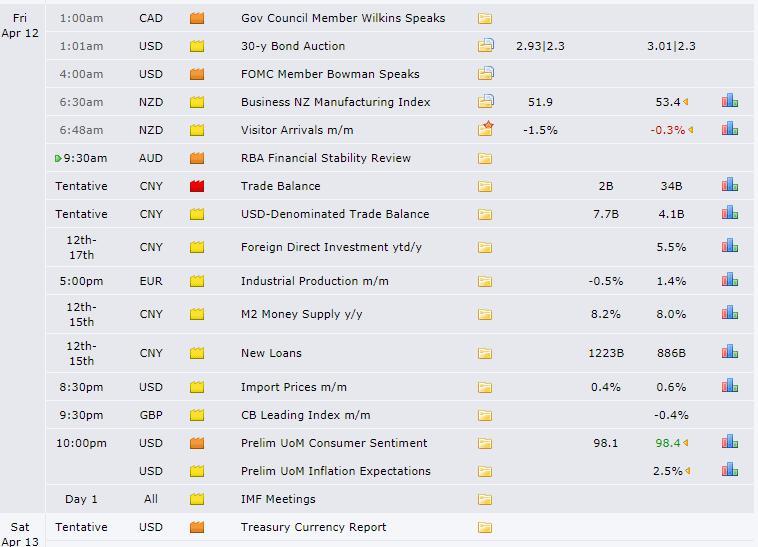
Source: Forexfactory
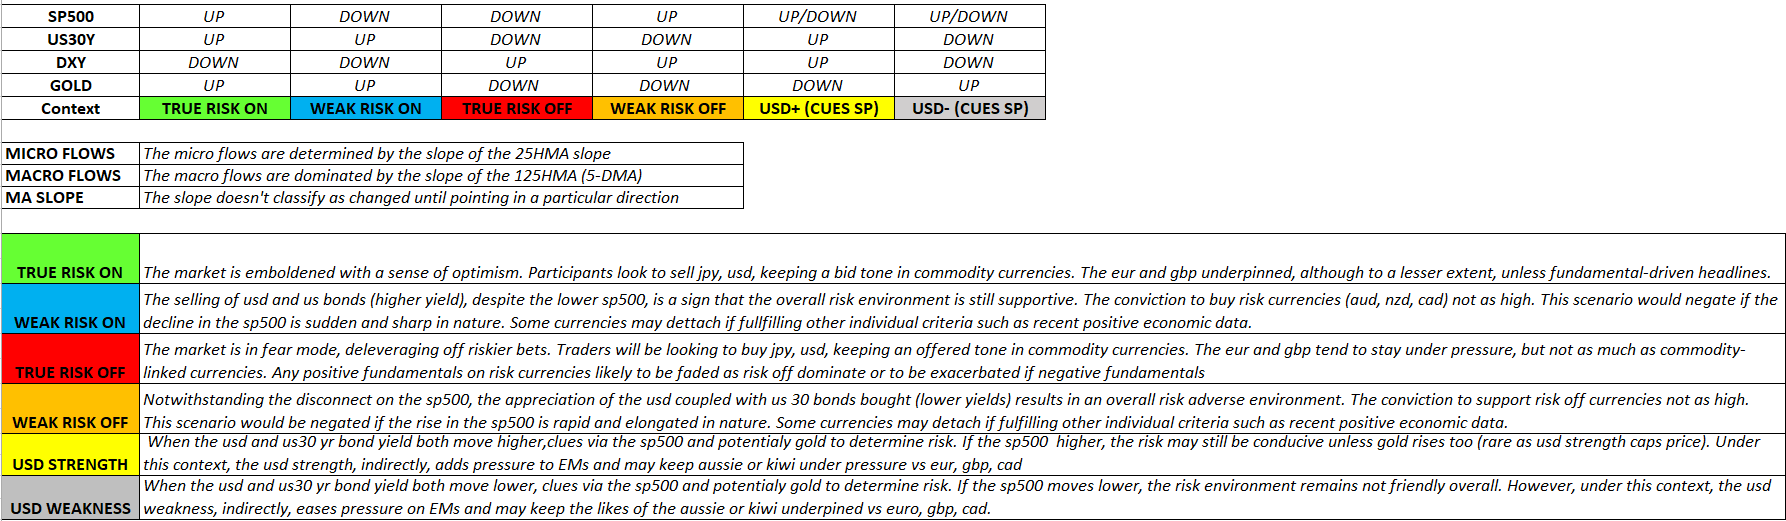
RORO (Risk On, Risk Off Conditions)
Remember that the table below is dynamic. I take as reference the micro slopes at the end of business in New York (5pm), but you must be constantly adapting to the ebbs and flows as there is a constant permutation of dynamics depending on the ever-evolving flow of fundamental information, technicals influencing price, etc. The official micro context we found ourselves in at the cutoff time on Thursday reflected an environment of USD strength in a context of neutral to bearish stocks, even if this last assessment must be taken with a big bucket of salt as the S&P 500 continues to be in a strong macro trend. If the USD can sustain its recent gains, it should act as a negative vs commodity currencies such as the AUD, CAD, NZD, especially if the established bearish micro trends in Oil and the S&P 500 by the NY close can be maintained, which in the case of the latter is a tall order as I mentioned, given the macro bullish outlook, so be extremely caution. Remember, it's only when we can combine a weaker USD and rising equities that currencies such as the AUD and the CAD will ripe the most benefits, the latter with an influence on Oil too, as said.
Latest Key Technical Developments In G8 FX
Interested about downloading today's key levels? Find the MT4 templates, updated daily, by clicking the following link.
EUR/USD: Multiple Attempts To Break Higher
The fact that the EUR is back retesting its recent trend highs even as we just went through a spell of strong USD demand in the last American session, speaks volumes of the micro bullish sentiment in the currency. This is far from being the best exchange rate to exploit the fortitude of the Euro though, as there are other currencies such as the commodity-linked block where gains have been much more evident as intermarket flows turn less friendly these currencies (AUD, CAD, NZD). Should we see acceptance above 1.1285-90, another key resistance lies overhead at 1.13 (lots of offers eyed due to its confluence with the ADR limit, hourly resistance, round number). Should the momentum higher extent heading into next week, the area 1.1325 (100% proj) is the target of the potential leg up.
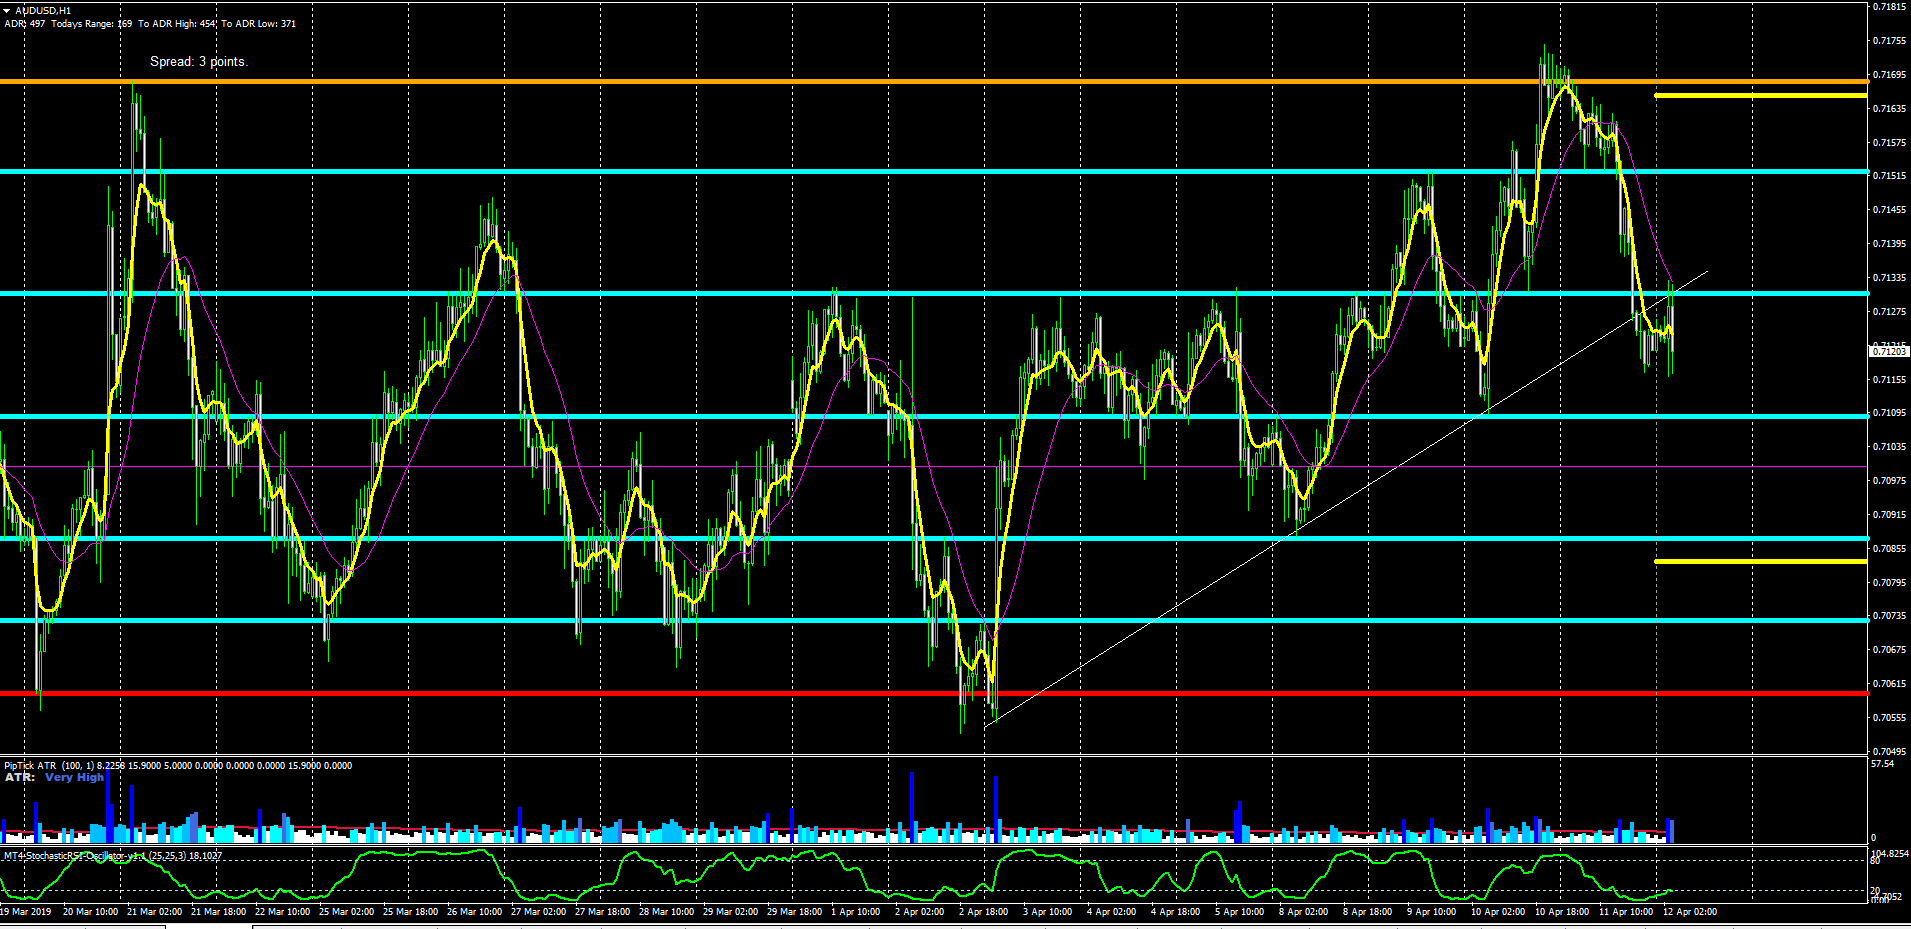
AUD/USD: The Squeeze Continues, Bottom-Side Liquidity Eyed
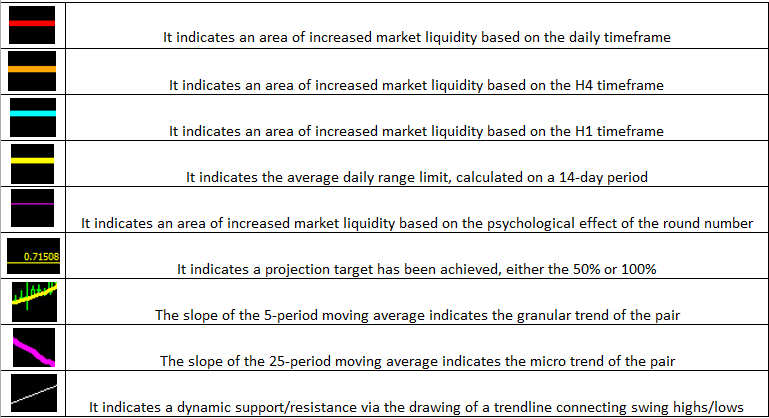
With equities struggling to extend gains as depicted by the downward slope of the 25-HMA and the dynamics around the DXY improving markedly, the Aussie has been hit by consistent supply. The latest round trip in the Aussie through 0.7170 only to be snapped back down en-route towards 0.7108-0.71 liquidity-rich area, comes to show the true rotational nature of these markets. The move down has effectively violated the bullish cycle as the ascending trendline is taken out, while the impulsivity of the selloff suggests there is definitely merit for this leg to represent a meaningful top.
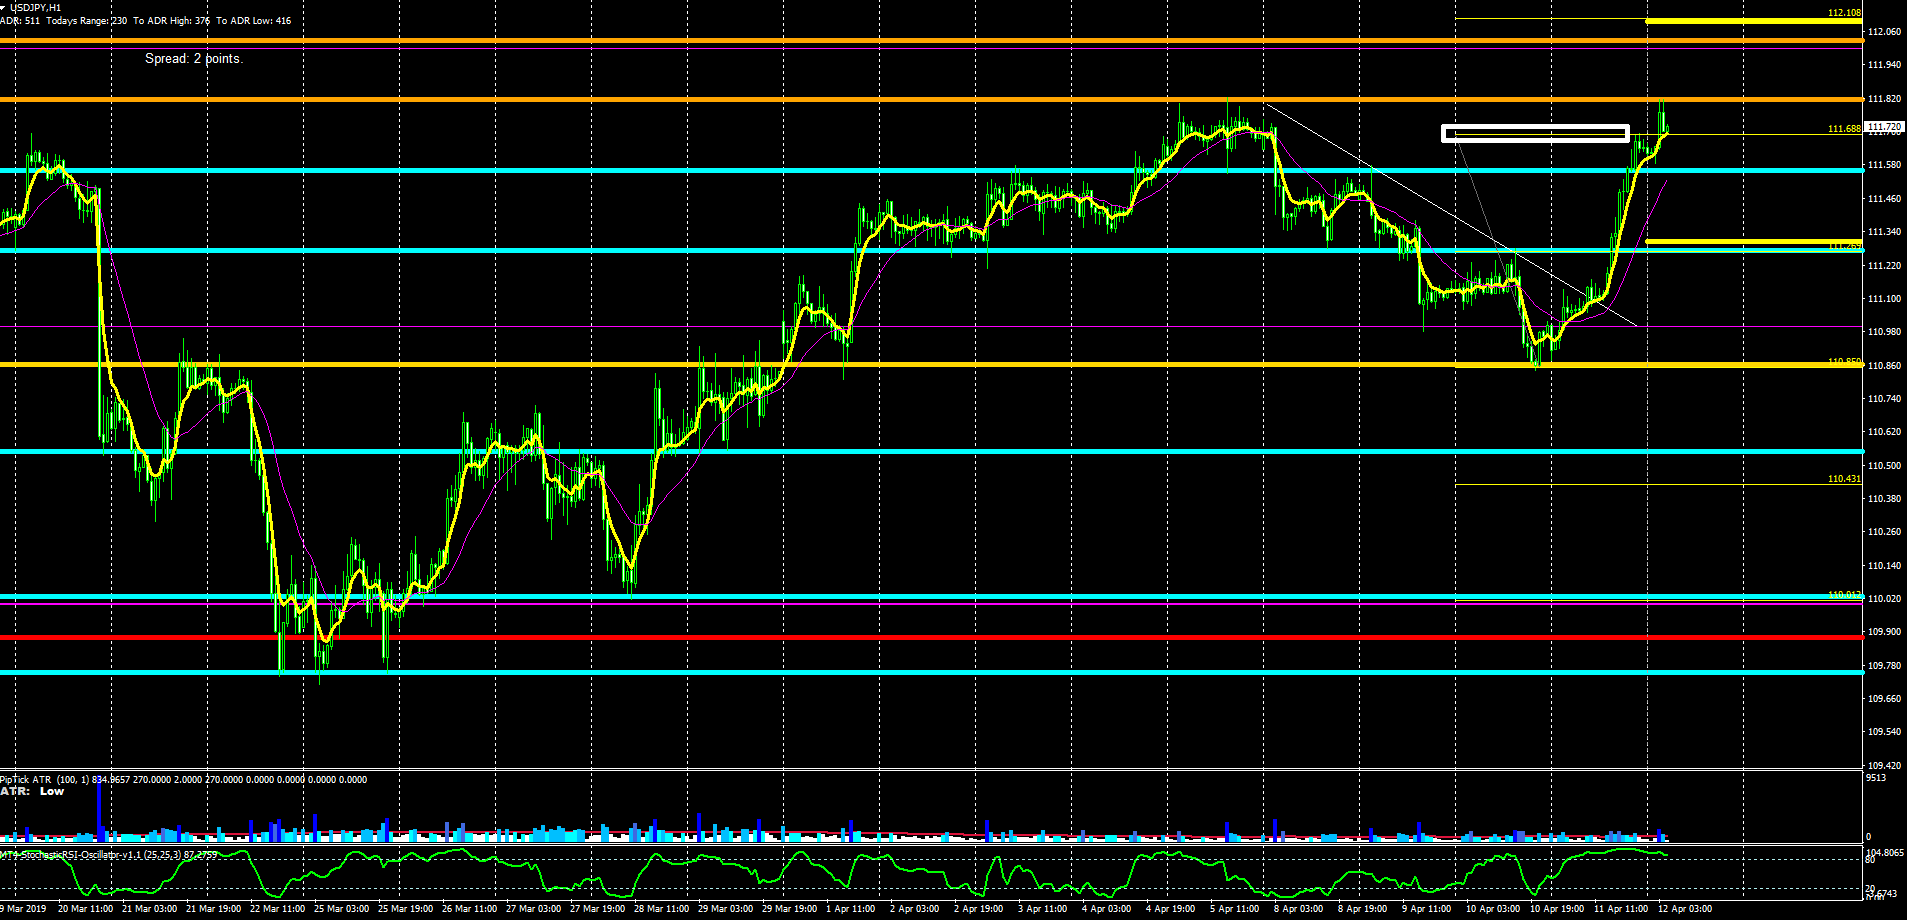
USD/JPY: Retesting Liquidity-Rich Resistance Area
There is no denying that the bullish momentum on this exchange rate is very strong, and testament of it is what buyers were able to achieve, that is, breaking through the 100% proj target of 111.69 and retest the 111.80. I am now expecting pockets of demand to support the pair on shallow pullbacks as the 111.55-69 gets revisited, with a key intersection to take control now at play circa 111.80. Judging by the bullish micro slopes in the DXY and US 30-year bond yields, the intermarket flows should stay supportive of this pair, even if the downturn in the S&P 500 micro slope acts as a counterbalance.
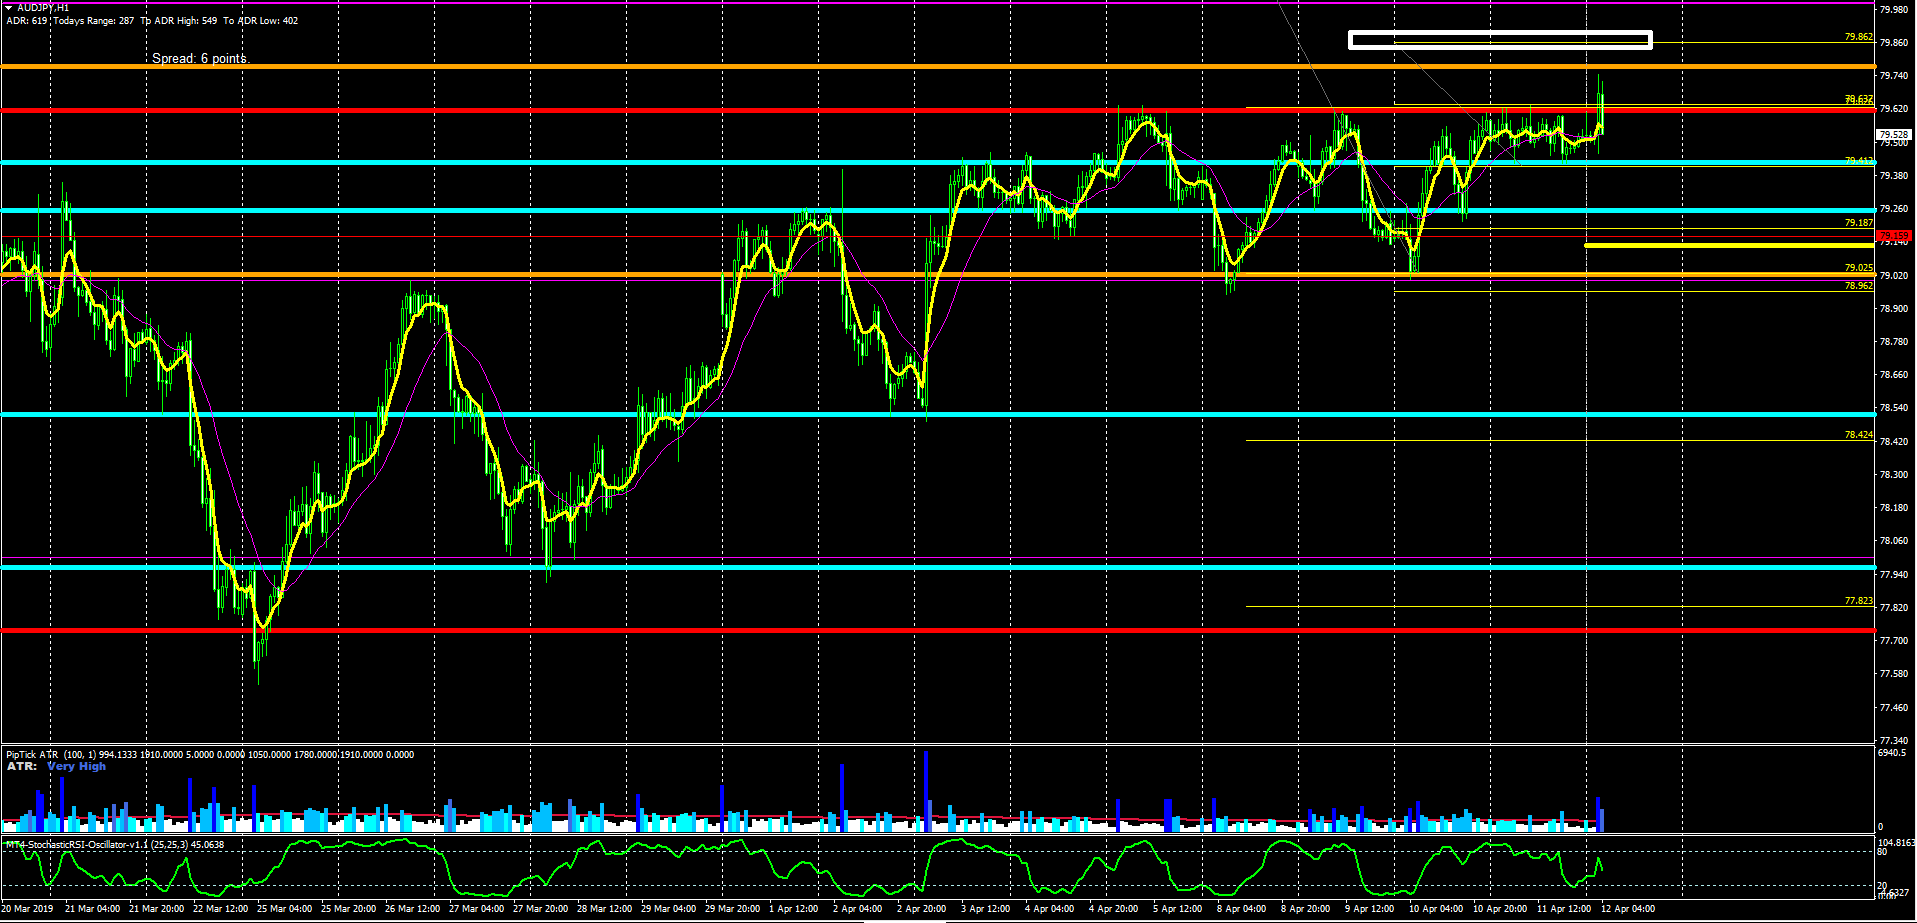
AUD/JPY: Takes A Crack At Resistance, Caution Warranted
The saturated price action right underneath the critical level of resistance reflects a market feeling more comfortable to accept higher prices as the bidding pressure goes on. In the early hours of Asia, we’ve finally seen the breakout transpire, which has allowed testing the next key level of resistance around the 79.75 ahead of the 80.00. With no stimulus to come out of the economic calendar and no much expected in the way of relevant news, I foresee the market struggling to fill out the heavy tier of offers resting ahead, which should be broadly spread out across the 79.75-80.00 price intervals. Also notice, from an intermarket flows perspective, we are starting to see value selling high prices as the S&P 500 micro slopes turns lower in an environment (by the NY close) of USD strength, even if this has been somewhat reversed in the early hours of the Friday session in Asia.
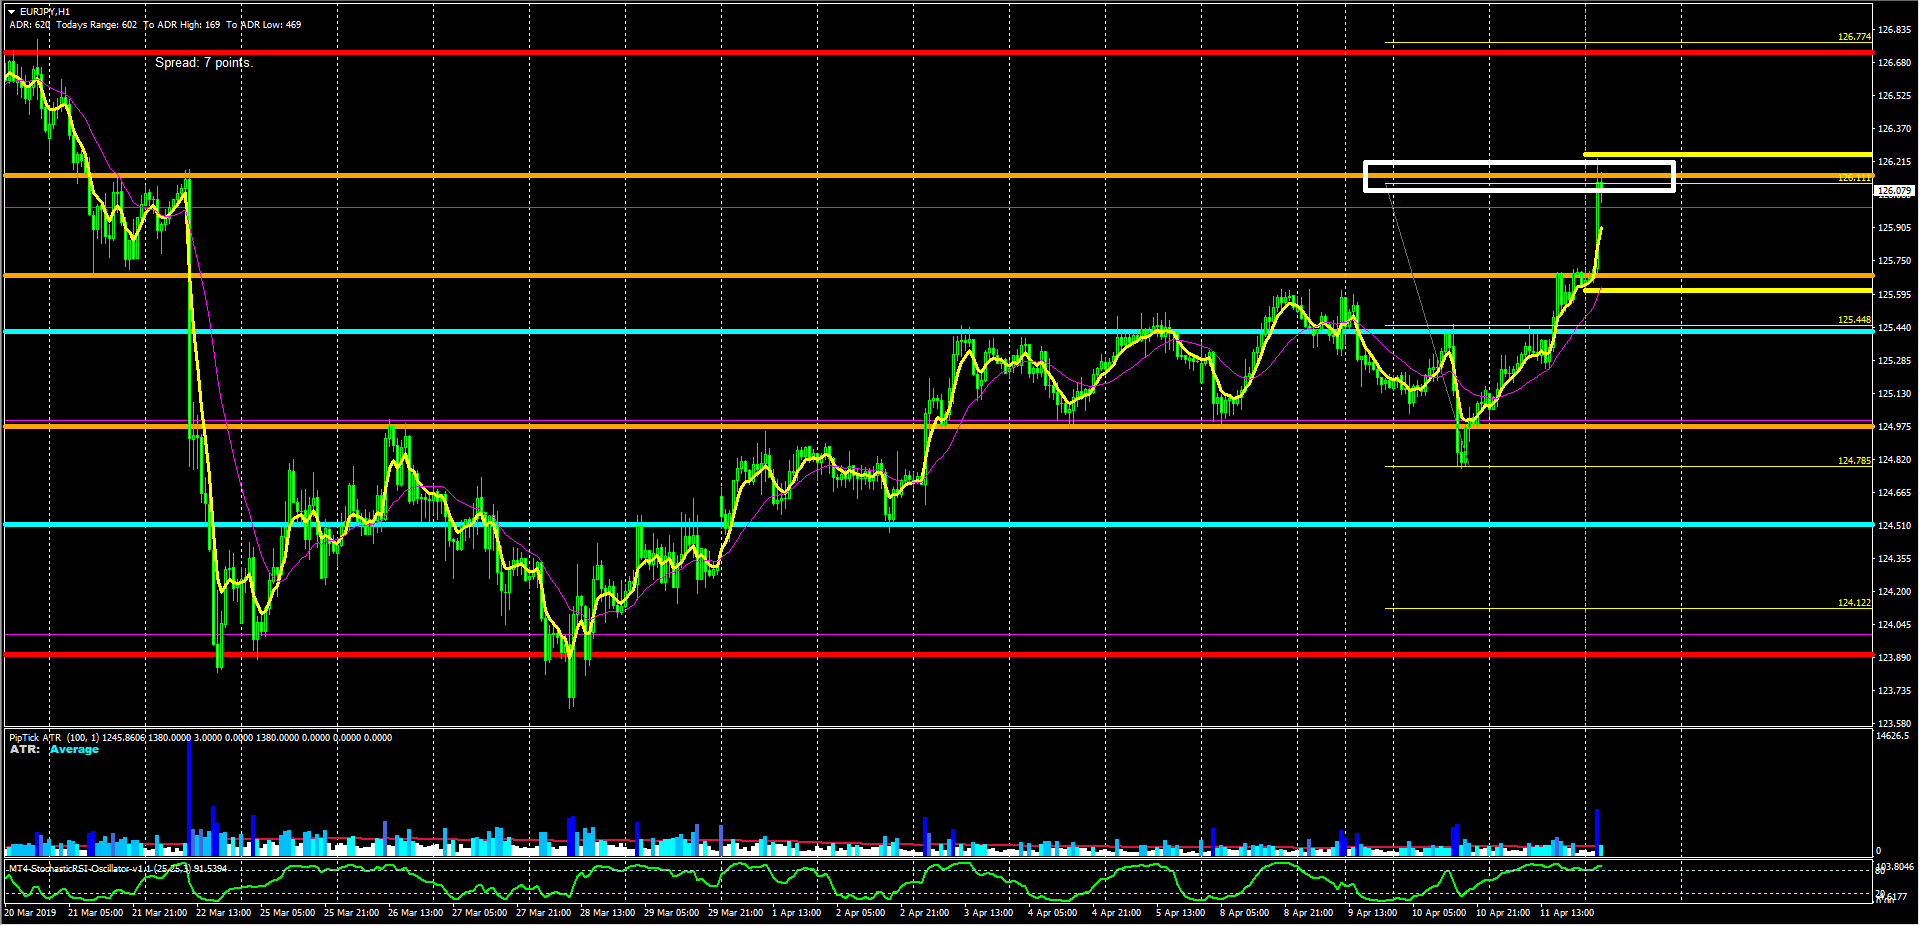
EUR/JPY: Spike Towards 100% Proj Target (NYSE:TGT)
Most of the gains for the day appear to have been made just 1h into the Tokyo open. If one judges at the area where the spike has landed to, you’d have to be very courageous to envision much further gains from here for the remainder of the year. The area of 126.15-25 intersects with the 100% proj target, a horizontal level of resistance derived off the H4 chart, and the ADR limit. Shallow pullbacks towards the 126.00 to play a tight range game is what I’d be expecting, with the risk of a deeper pullback should risk off conditions pick up steam in the session to come. By the close of business in NY, the bearish micro slope in the S&P 500 and the bullish ones in the DXY/US30Y, makes me think that the move seen in this exchange rate looks rather overstretched.

Important Footnotes
- Risk model: The fact that financial markets have become so intertwined and dynamic makes it essential to stay constantly in tune with market conditions and adapt to new environments. This prop model will assist you to gauge the context that you are trading so that you can significantly reduce the downside risks.
- Cycles: Markets evolve in cycles followed by a period of distribution and/or accumulation. The weekly cycles are highlighted in red, blue refers to the daily, while the black lines represent the hourly cycles.
- POC: It refers to the point of control. It represents the areas of most interest by trading volume and should act as walls of bids/offers that may result in price reversals. The volume profile analysis tracks trading activity over a specified time period at specified price levels. The study reveals the constant evolution of the market auction process.
- Tick Volume: Price updates activity provides great insights into the actual buy or sell-side commitment to be engaged into a specific directional movement. Studies validate that price updates (tick volume) are highly correlated to actual traded volume, with the correlation being very high, when looking at hourly data.
- Horizontal Support/Resistance: Unlike levels of dynamic support or resistance or more subjective measurements such as fibonacci retracements, pivot points, trendlines, or other forms of reactive areas, the horizontal lines of support and resistance are universal concepts used by the majority of market participants.
- Trendlines: Besides the horizontal lines, trendlines are helpful as a visual representation of the trend. The trendlines are drawn respecting a series of rules that determine the validation of a new cycle being created. Therefore, these trendline drawn in the chart hinge to a certain interpretation of market structures.
- Correlations: Each forex pair has a series of highly correlated assets to assess valuations. This type of study is called inter-market analysis and it involves scoping out anomalies in the ever-evolving global interconnectivity between equities, bonds, currencies, and commodities.
- Fundamentals: It’s important to highlight that the daily market outlook provided in this report is subject to the impact of the fundamental news. Any unexpected news may cause the price to behave erratically in the short term.
- Projection Targets: The usefulness of the 100% projection resides in the symmetry and harmonic relationships of market cycles. By drawing a 100% projection, you can anticipate the area in the chart where some type of pause and potential reversals in price is likely to occur, due to 1. The side in control of the cycle takes profits 2. Counter-trend positions are added by contrarian players 3.