Updating the scenario for ETH/USD. What are the prospects for the most popular altcoin?
The following types of analysis were used in this forecast: fundamental analysis, candlestick analysis, panoramic market survey, market balance level analysis, oscillator analysis, volume analysis, and trend analysis.
Obviously, yesterday's bitcoin analysis should be followed by the analysis of the etherium as the second most important crypto currency asset.
I made my last forecast for the ETH/USD a month ago and, of course, and it needs to be updated. For the sake of justice, I want to say that my previous scenario for the Ether was implemented for almost 100%.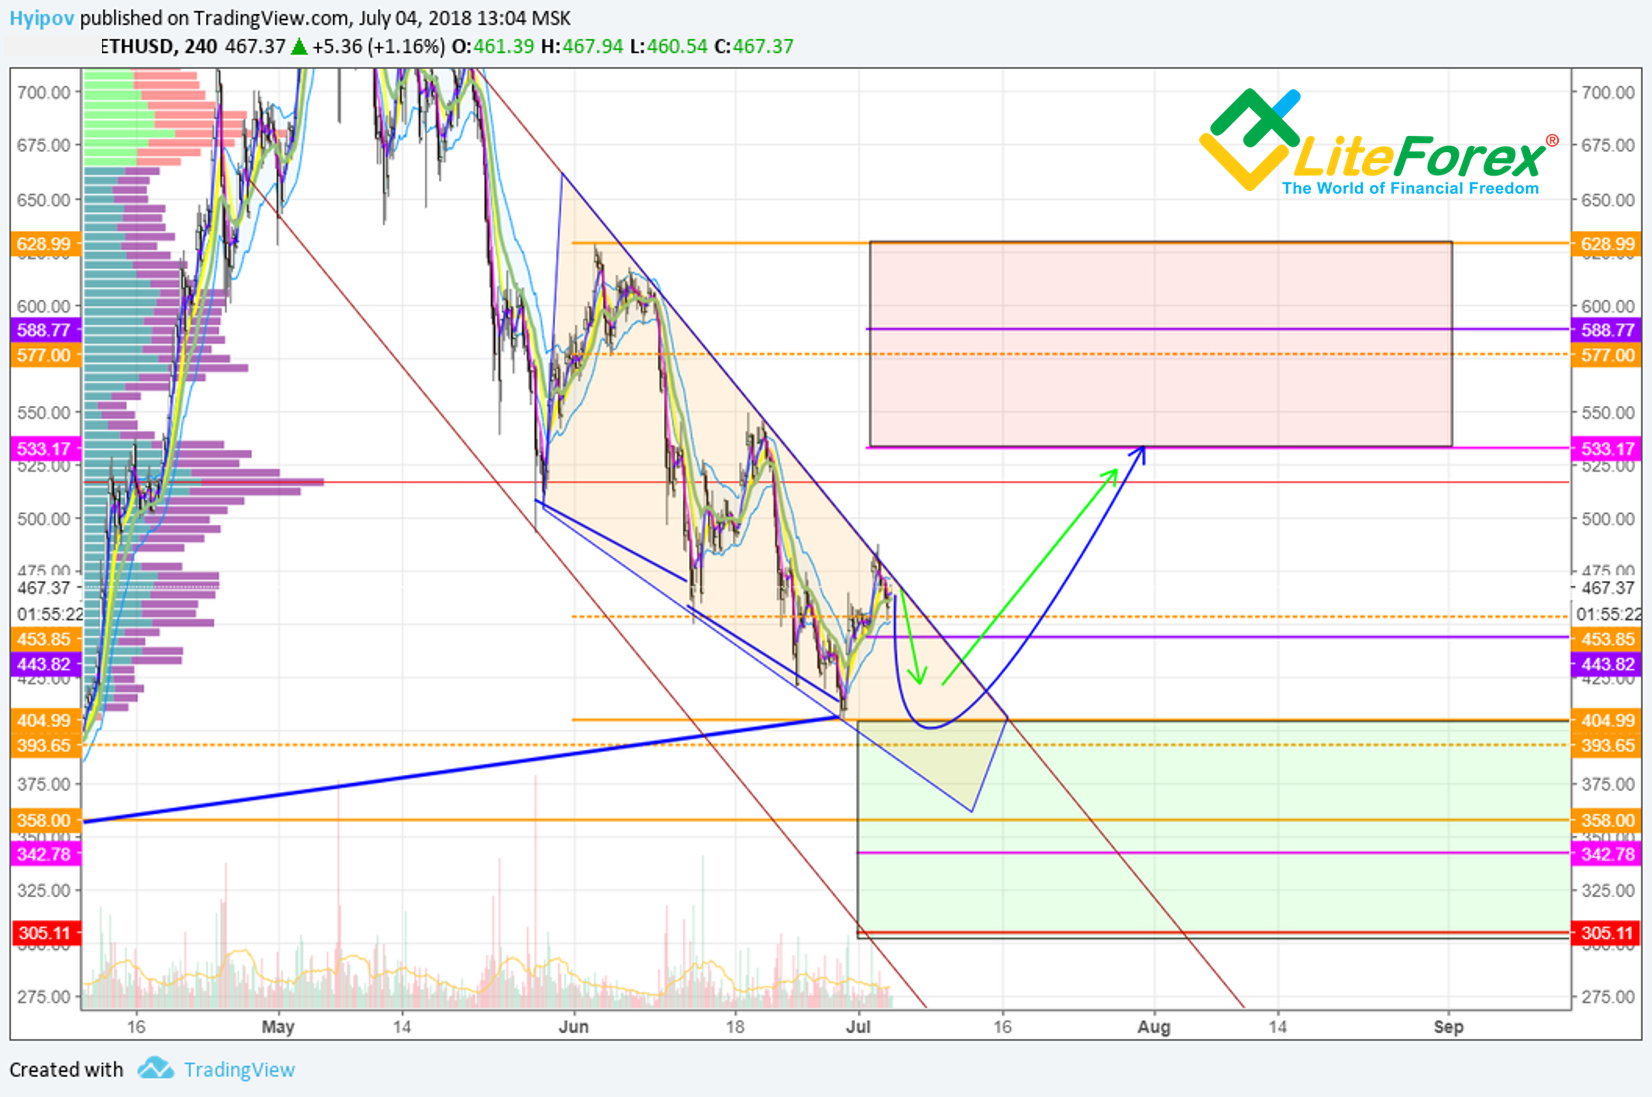
In the ETH/USD chart below, you can see that the ticker did not reach the final target by just 17 USD, which is within the statistical error range for a medium-term forecast.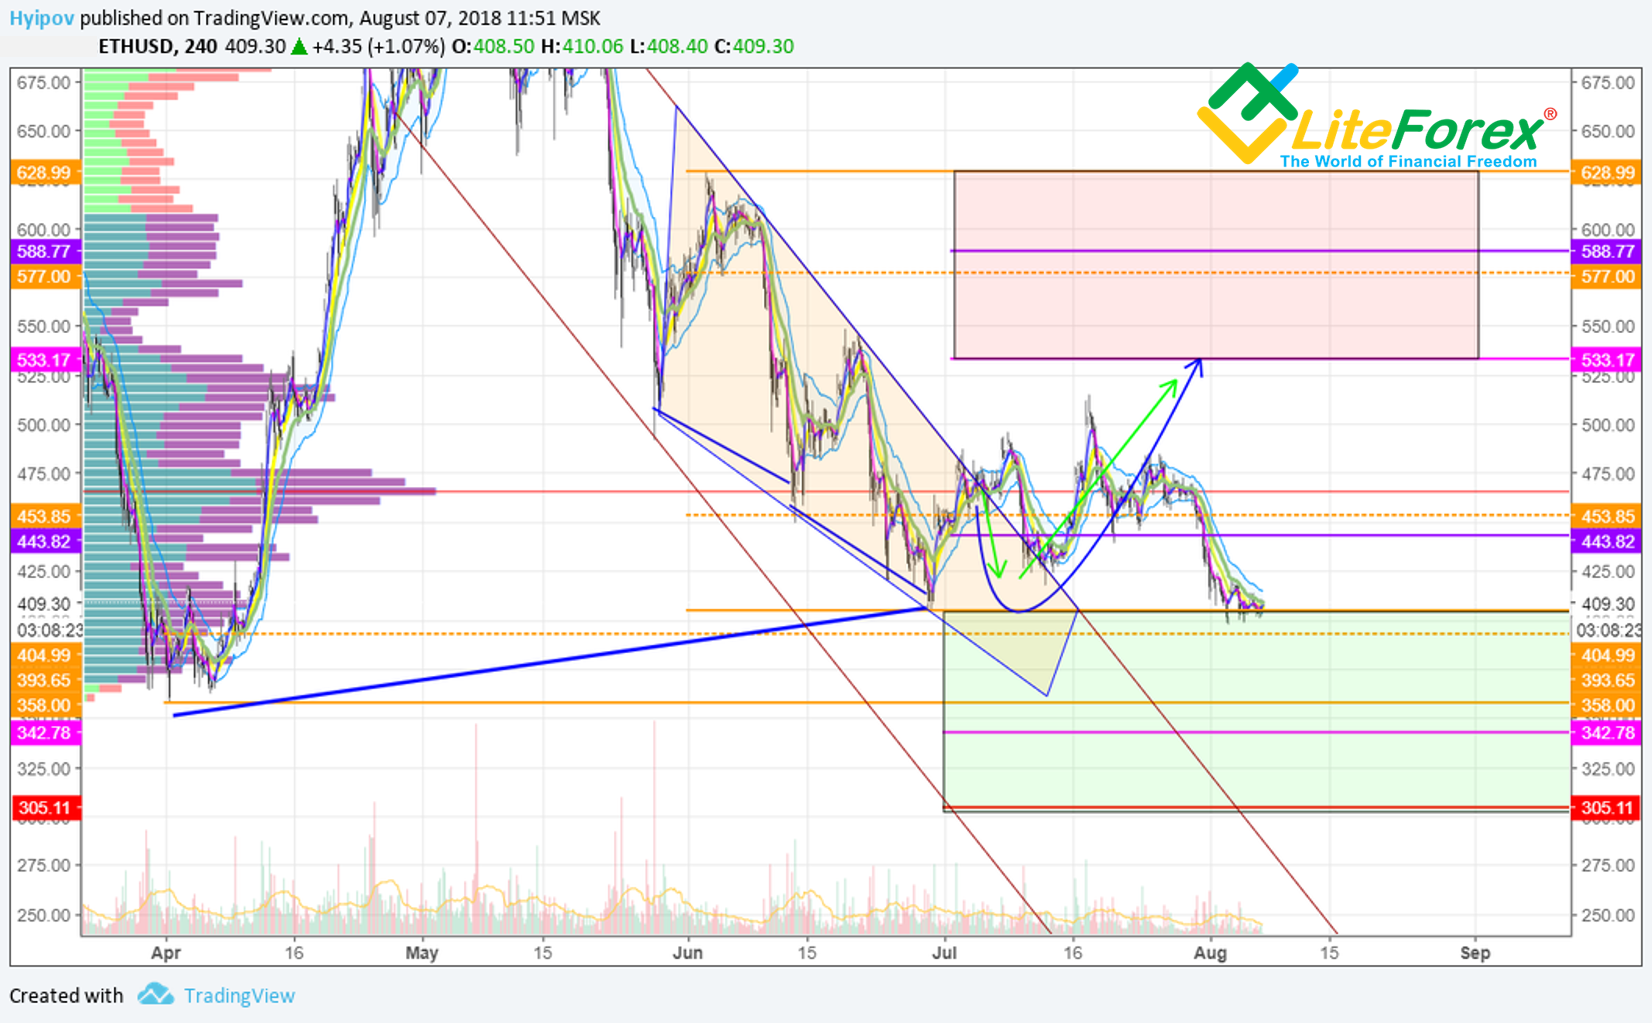
For the second half of July, the market changed its mood and started a sideways movement.
From the fundamental point of view, I don't see any significant negative factors capable of crashing ethereum below current values. In general, the whole news background for the last month is quite positive for the growth of the ETH.
One of the most important events right now is the testing of a new update package for the ethereum network called Constantinople. This package is the second one under the general project of updates called Metropolis.
Testing of the new Constantinople package will last for two more months. Therefore, in the short term, the innovations that come along with it should not affect the behavior of the ETH price.
The decline in the rate of ETH/USD in the current market conditions can be explained not by the internal factors of the asset itself, but rather by the state of the crypto currency market, where a huge flow of funds from all the altcoins to bitcoin has occurred since May (see the chart below).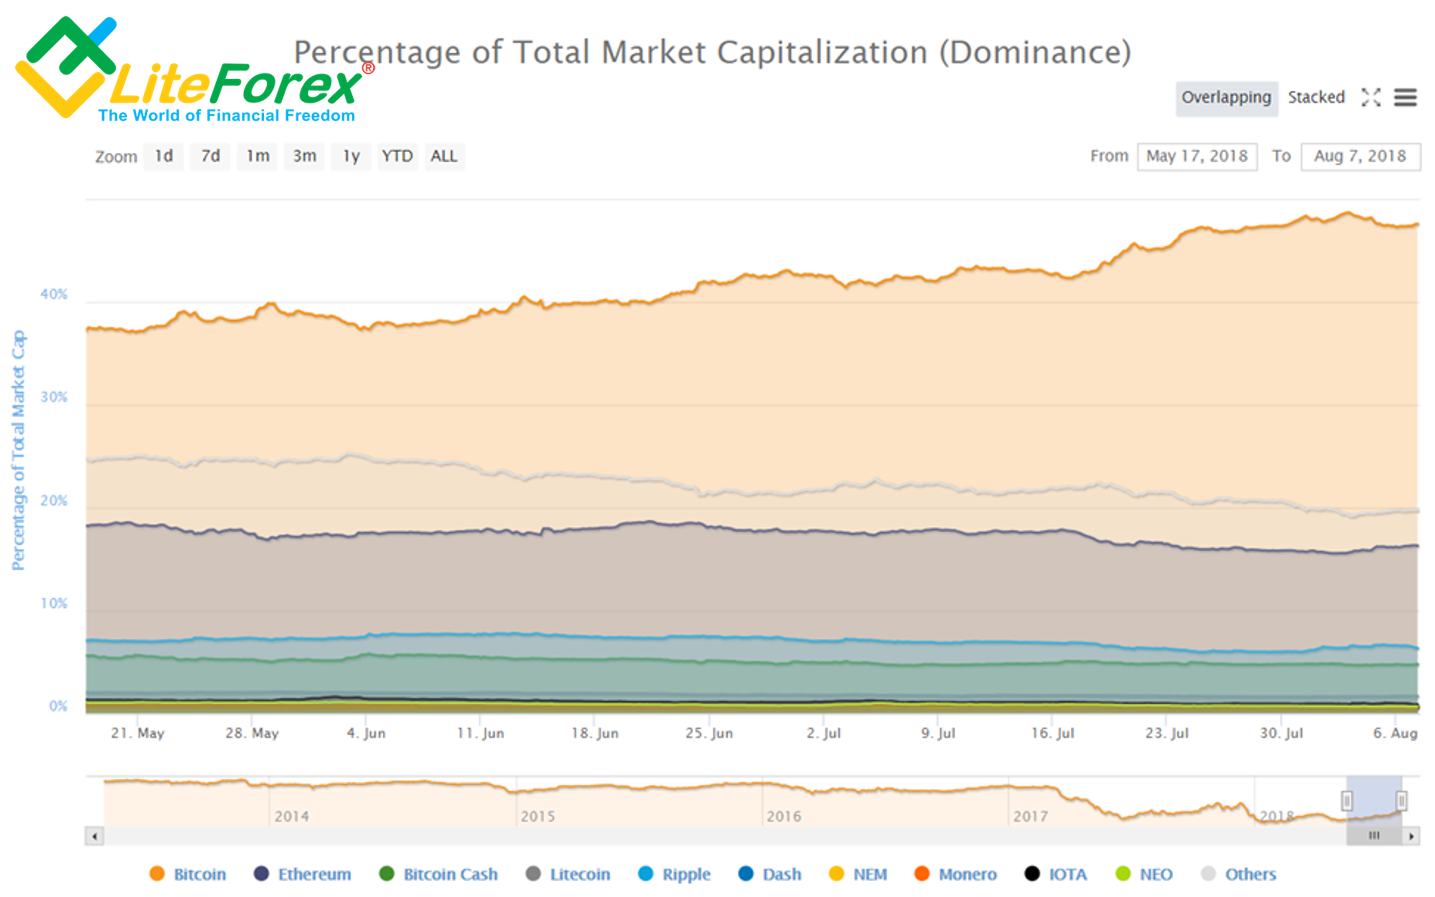
First of all, this is due to the fact that Bitcoin is still the most liquid one among all crypto currency assets, and it is easiest to exchange into fiat money if necessary. This tendency is typical for the bearish crypto currency market and occurs consistently.
Therefore, crypto currency investors hedge their risks, transferring funds to the safest assets from the fundamental point of view, which will be easiest to convert to fiat money if necessary.
If we look at the chart in a larger scale (see below), we can see that this process is cyclical and has an obvious regularity, in which, as Bitcoin's share increases, capitalization of other coins declines.
Now we see that the dominance of bitcoin is at the local peak, and then we can expect another redistribution of funds from BTC to the remaining altcoins, which will ensure their growth relative to their «grandfather».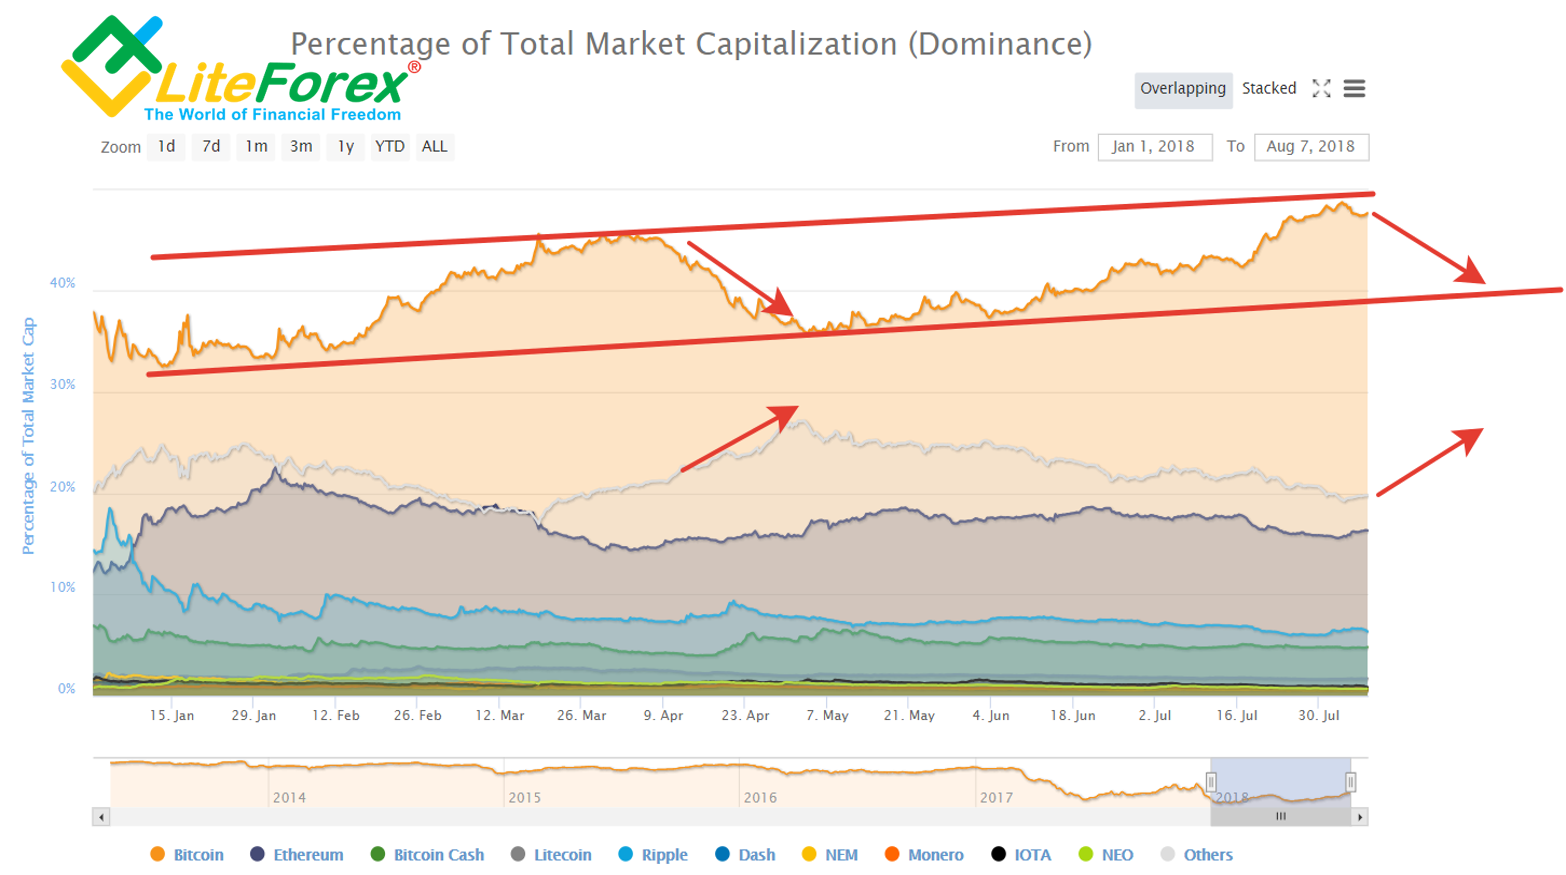
If my last forecast for BTC/USD remains in force, I do not expect a strong drawdown of bitcoin against the dollar in the near future, and if, and if altcoins grow in relation to the grandfather, then they will grow in relation to fiat currenciesas well.
In order to understand what scenario awaits us in these conditions, let's turn to the technical analysis of the ETH/USD pair.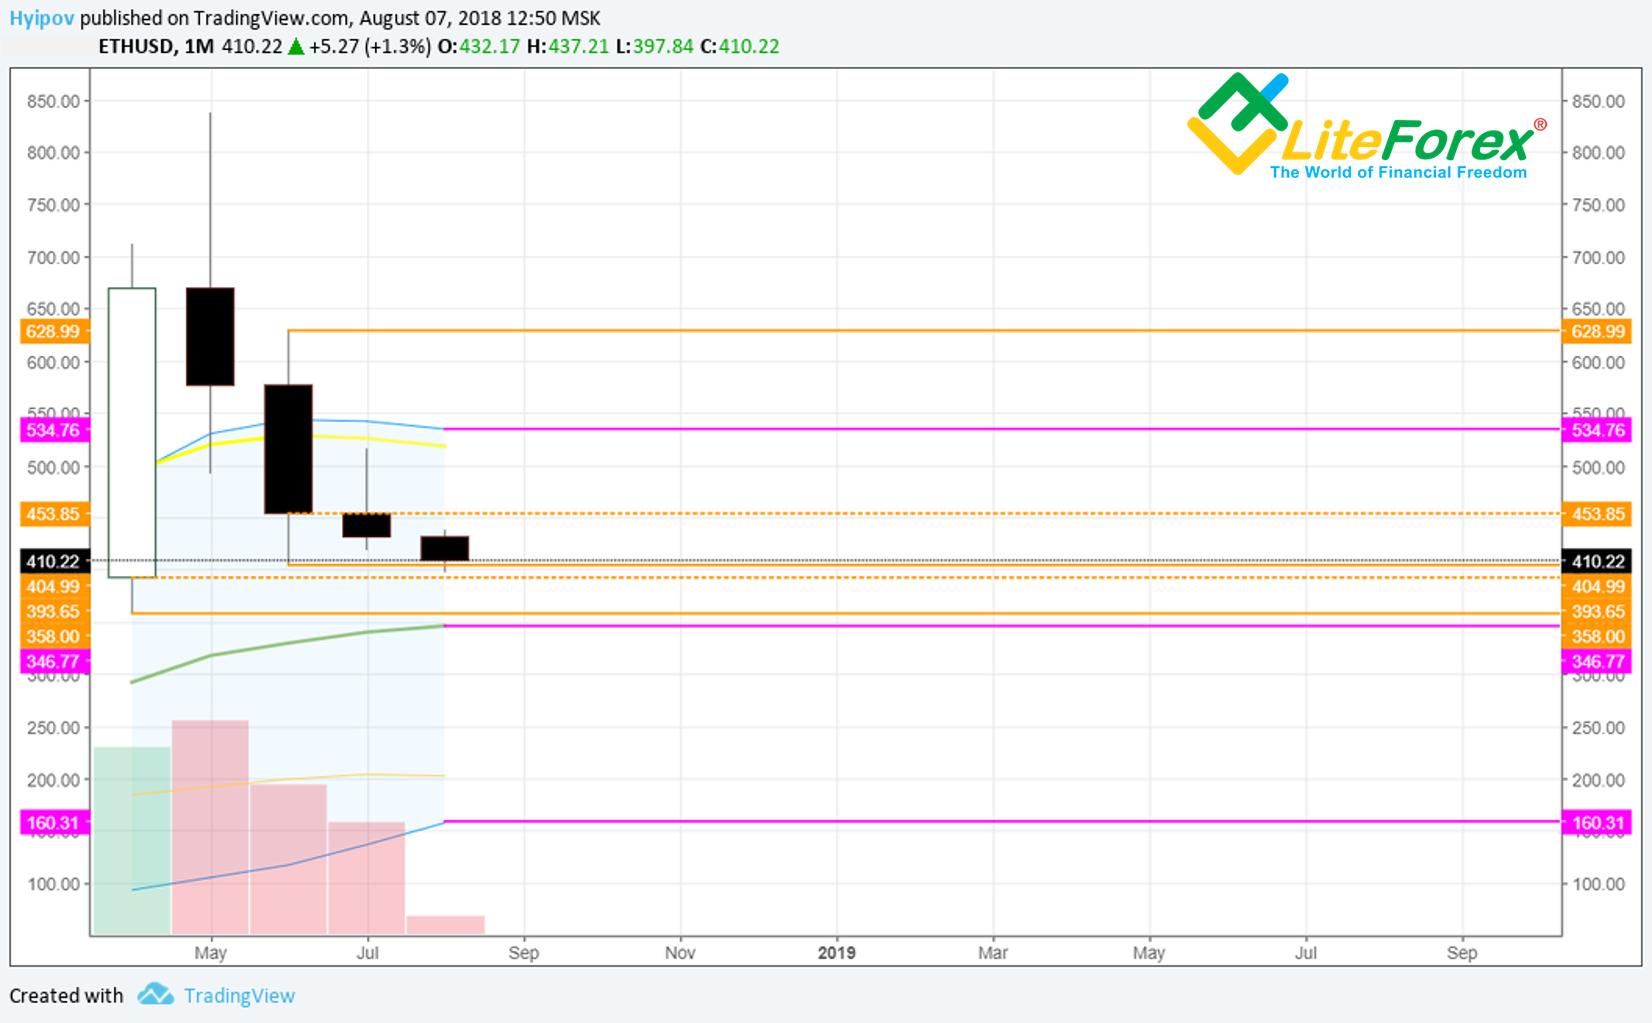
In the monthly TF, we see the closing of the previous month in the form of a candle with a long shadow up, this model could serve as the basis for a bullish reversal, however, the candle of the current month already managed to break through the lows of June and July, stopping only at the opening level of the April candle, which gives the basis for the further decline of the ETH.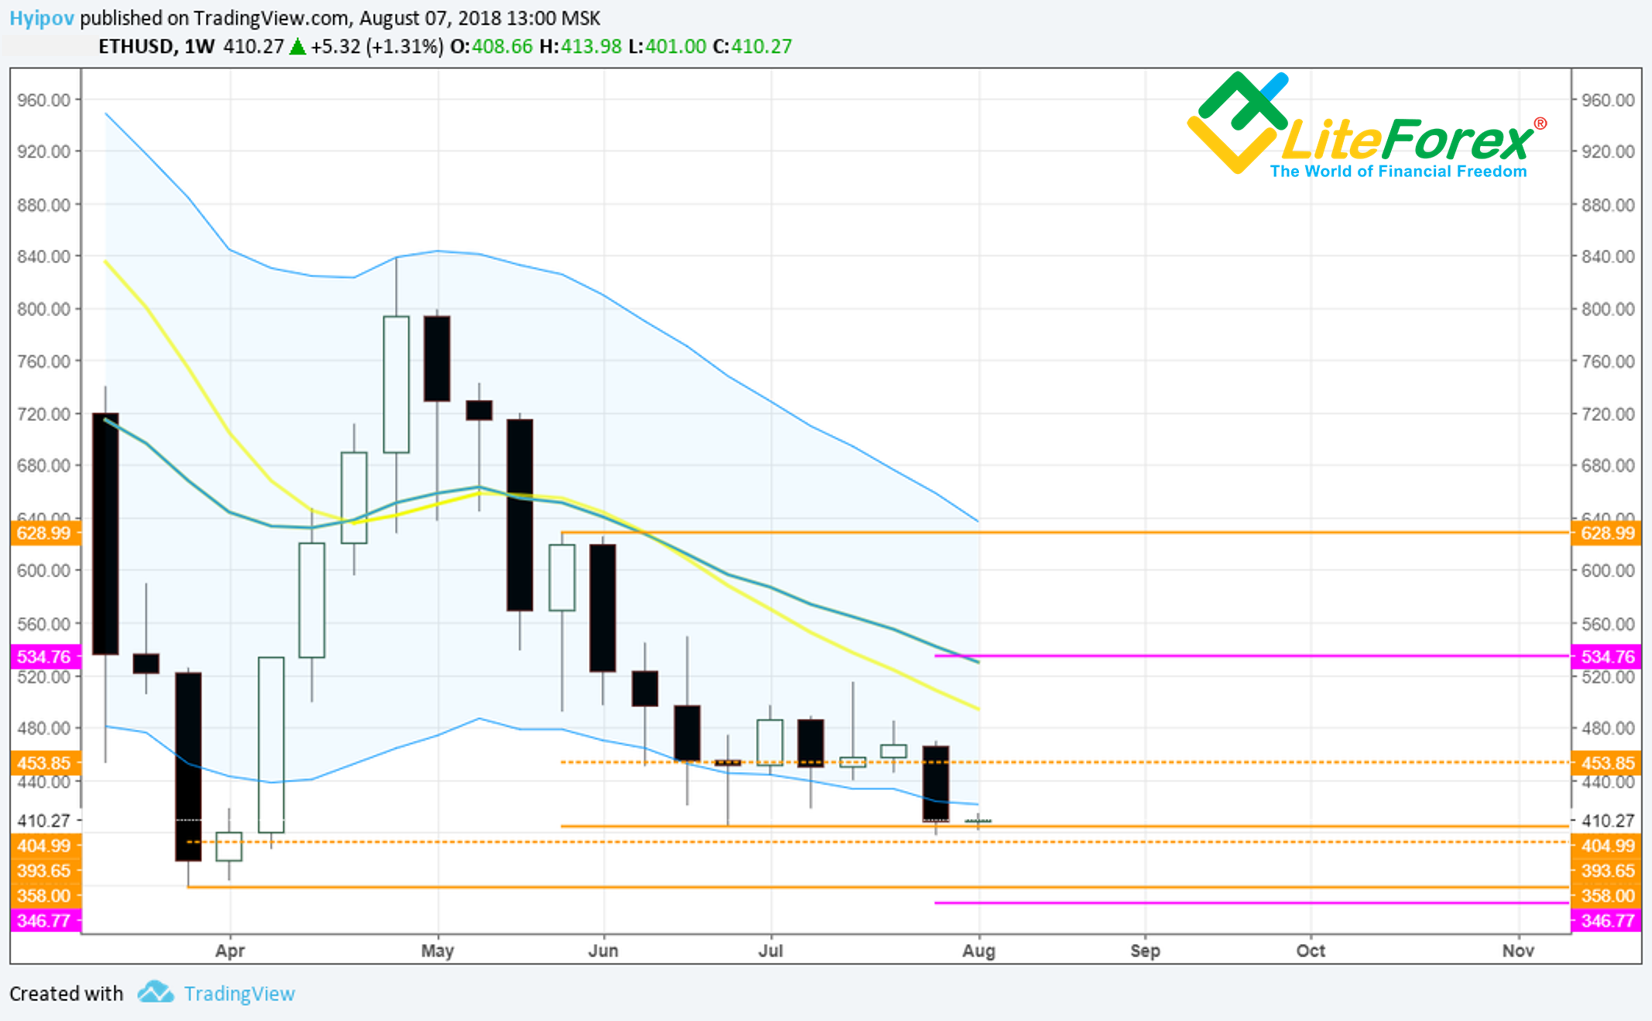
In the weekly chart, the picture is fundamentally similar.
We see that the ticker is on the lower bounds of the Keltner channel, which creates additional support, plus the lines mentioned above. All this together creates a wide support zone, which starts from 405 and ends at 358 USD. From below, this area is covered by the border of the monthly Keltner channel at 346 USD, creating additional support for the bulls (marked in purple)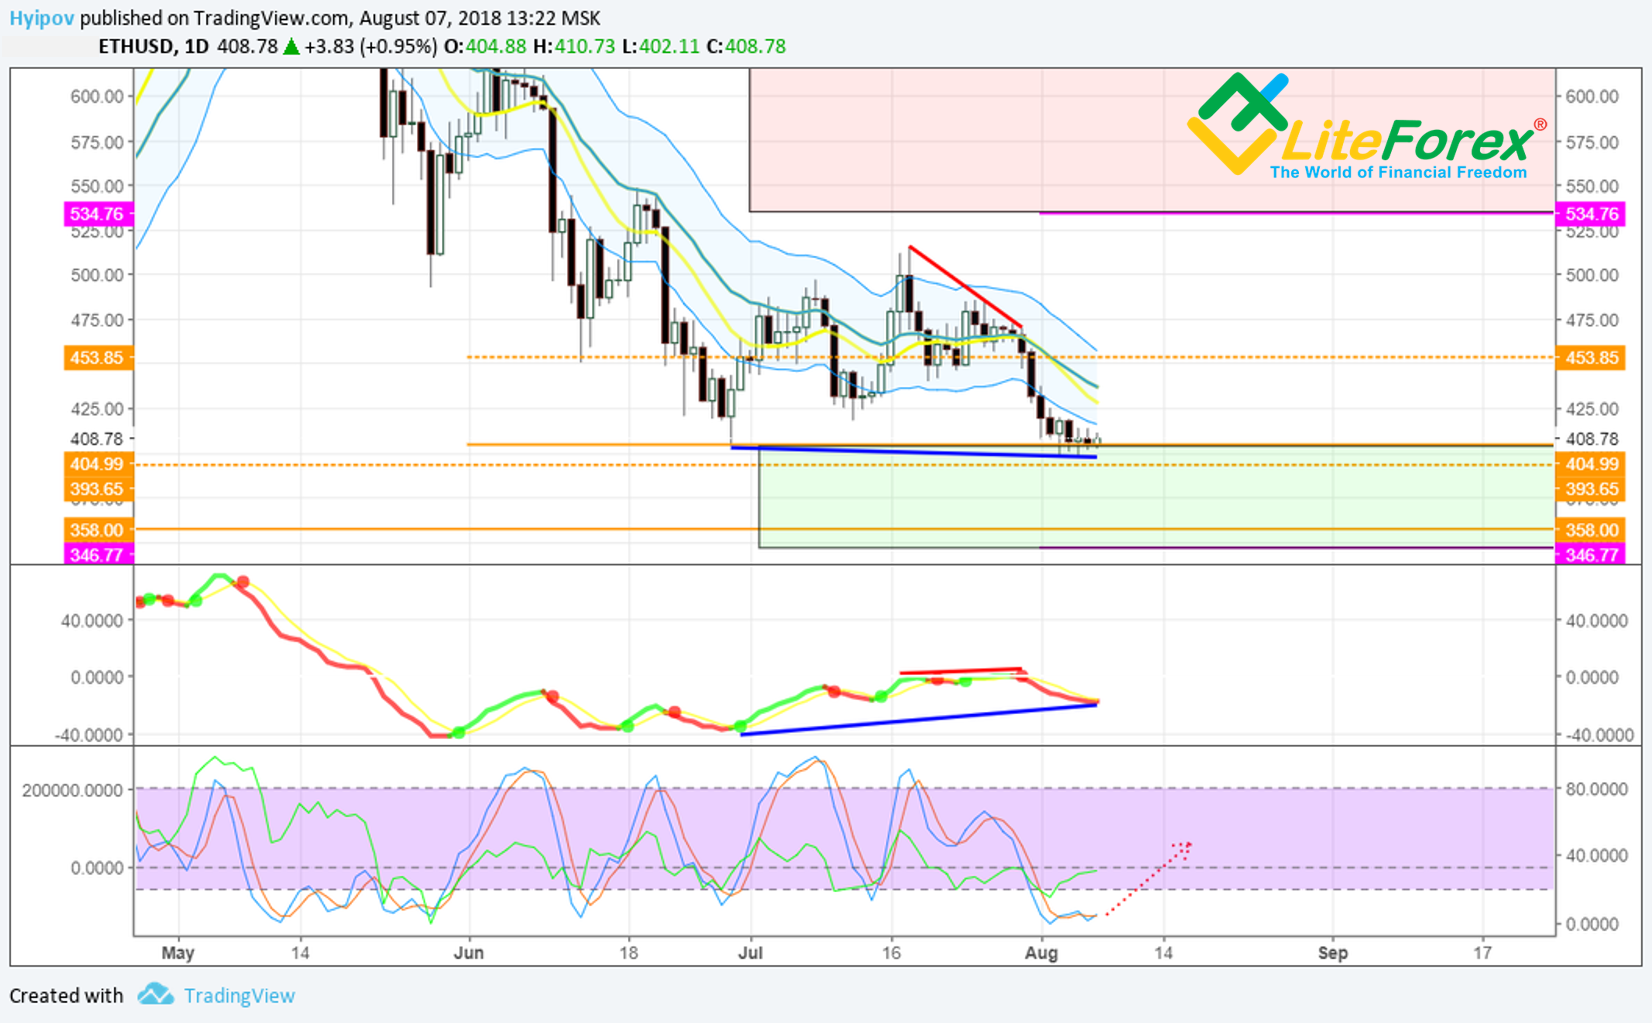
In the daily chart above, we see that the ticker has rested against the support zone, which is highlighted by the green area. At the same time, on the MACD, we can identify a hidden bull divergence, which is weakened by a bearish divider within its borders (marked with a red line)
Stochastic RSI is at the bottom of the indicator window. All this in general can speak of a small bullish correction or at least consolidation at current levels, but not about a reversal of the trend.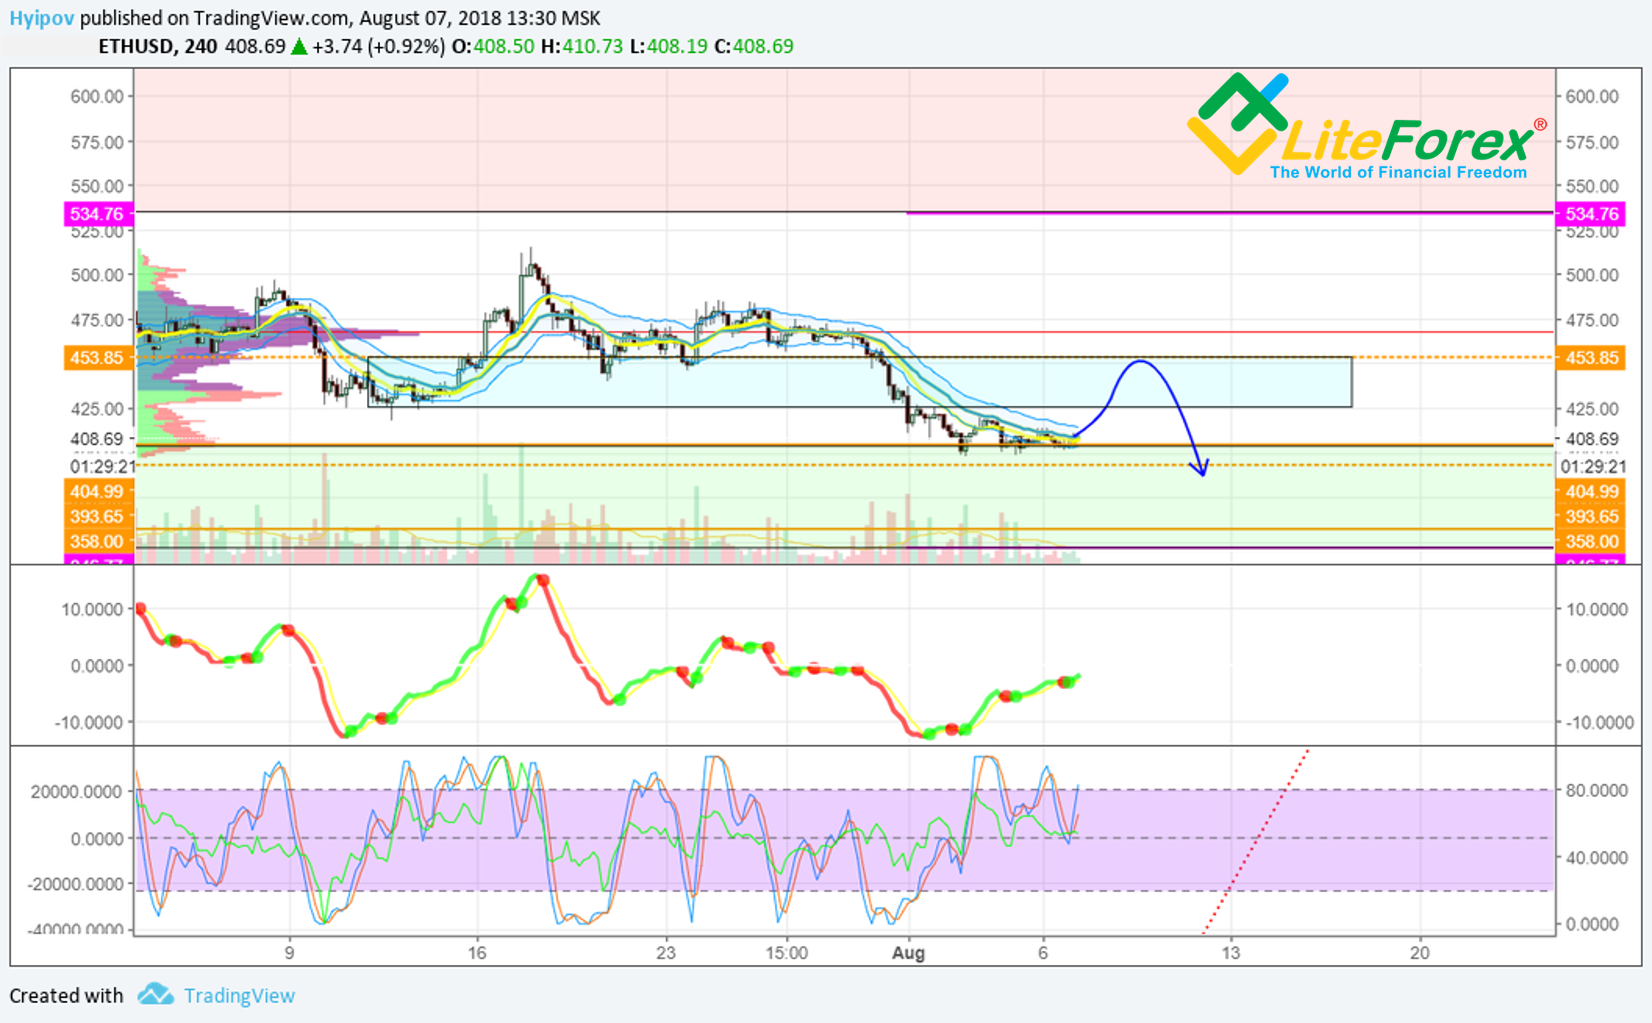
In the four-hour chart, too, everything is quite sour. The best-case csenario for the bulls is the attempt to retest the resistance zone in the area of 425 - 450 USD.
The absence of adequate trading volumes only confirms my words. Ethereum now clearly lacks the strength to rise from its knees, and consequently, after another attempt to get up, it is likely to fall again into the swamp of a wide support zone.
Summary
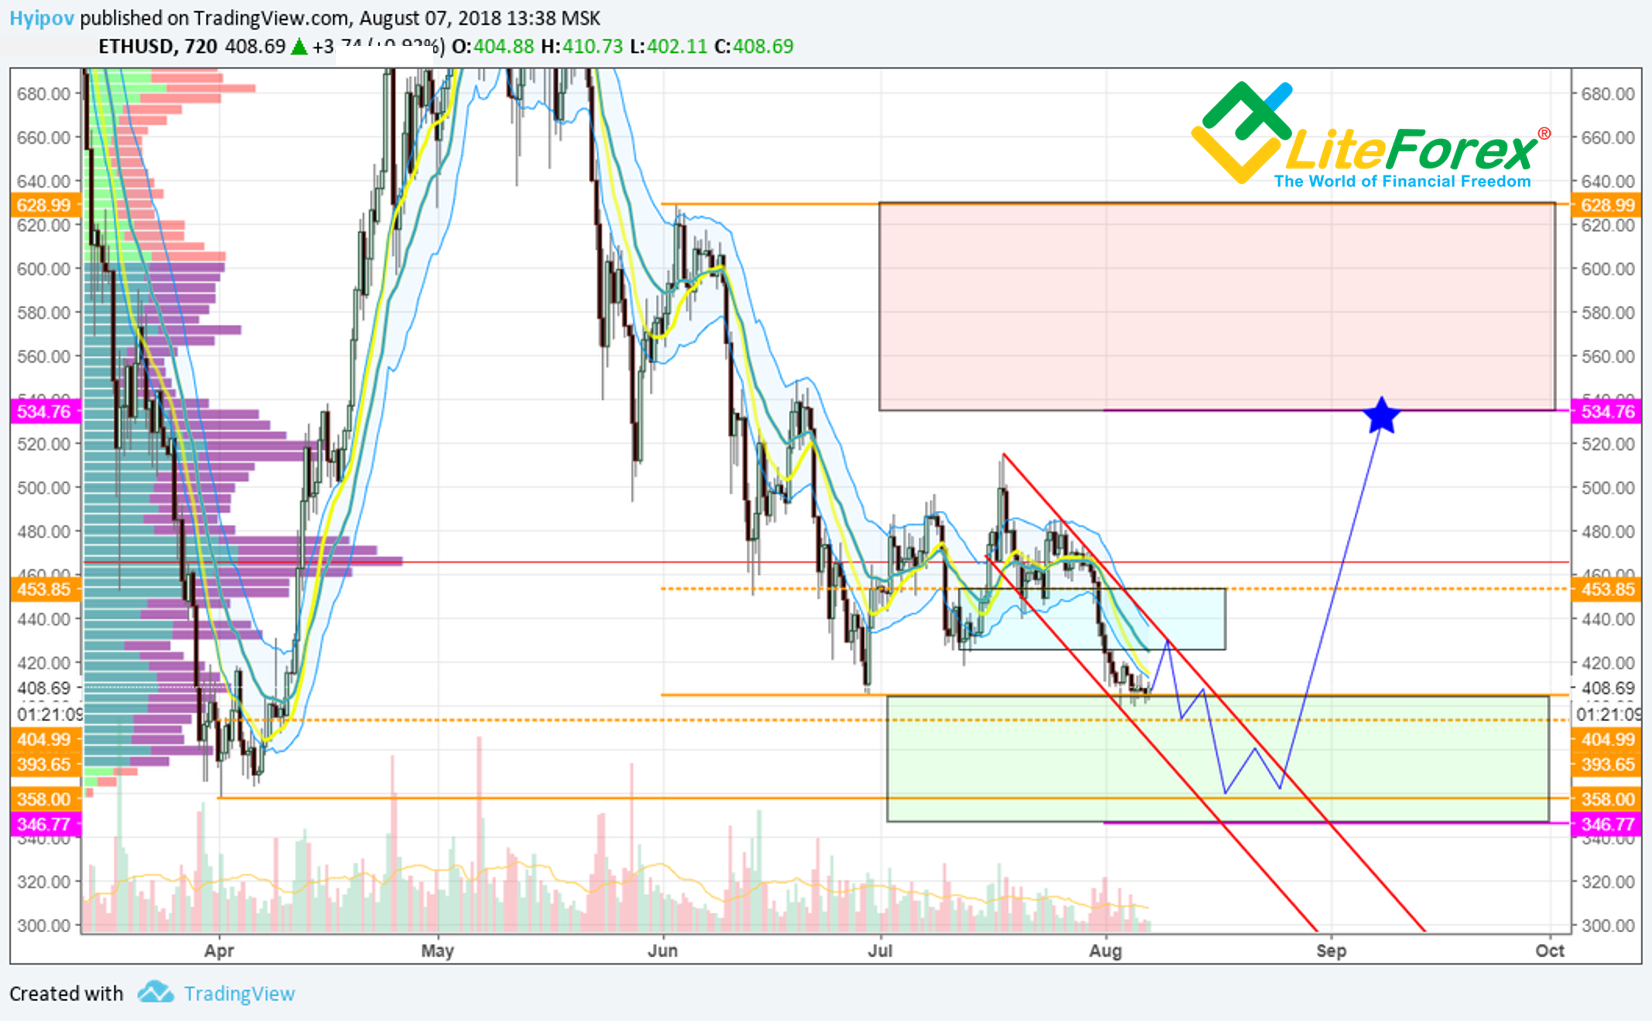
In general, in the next weeks the scenario for ethereum can not be referred to as bullish. We do not see obvious bullish patterns and signals for a reversal. The only thing that the bulls have to rely on is a broad support line, but entering the market only counting on a rebound is questionable tactics.
On the market, situations occur when it is better to be out of position than to vote for growth or decline with your money. This is the situation for the ETHUSD at the moment.
I propose to wait for the moment when either the current accumulation comes to an end or the market finally comes back to life and shows the desire to move. The fundamental factors contribute to this and we will be able to see the long-awaited growth of etherium soon.
This is my scenario for ETH/USD.
Best regards,
Mikhail @Hyipov
PS: If you agree with the forecast, leave a "+" in the comments to this post, if you do not agree, leave a "-". If you liked the post, leave a few words of gratitude and do not forget to share it with your friends.
Stay tuned to the latest developments in the crypto currency world, follow my publications in my blog.
