Analyzing Bitcoin
Updating the script and determining control points for future movements.
In this post, we used fundamental analysis, panoramic market survey, market balance level analysis, graphical analysis and trend analysis.
Dear friends,
I am happy to welcome you in my line of forecasts on crypto currencies after a long break. It has been more than two weeks since my last forecast for Bitcoin, so I think now everyone is primarily concerned about the fate of the BTC/USD. Well, today we will do a thorough analysis of bitcoin and discuss its prospects.
Let's have a look at my main scenario for bitcoin, which I made a month ago (see the chart below),
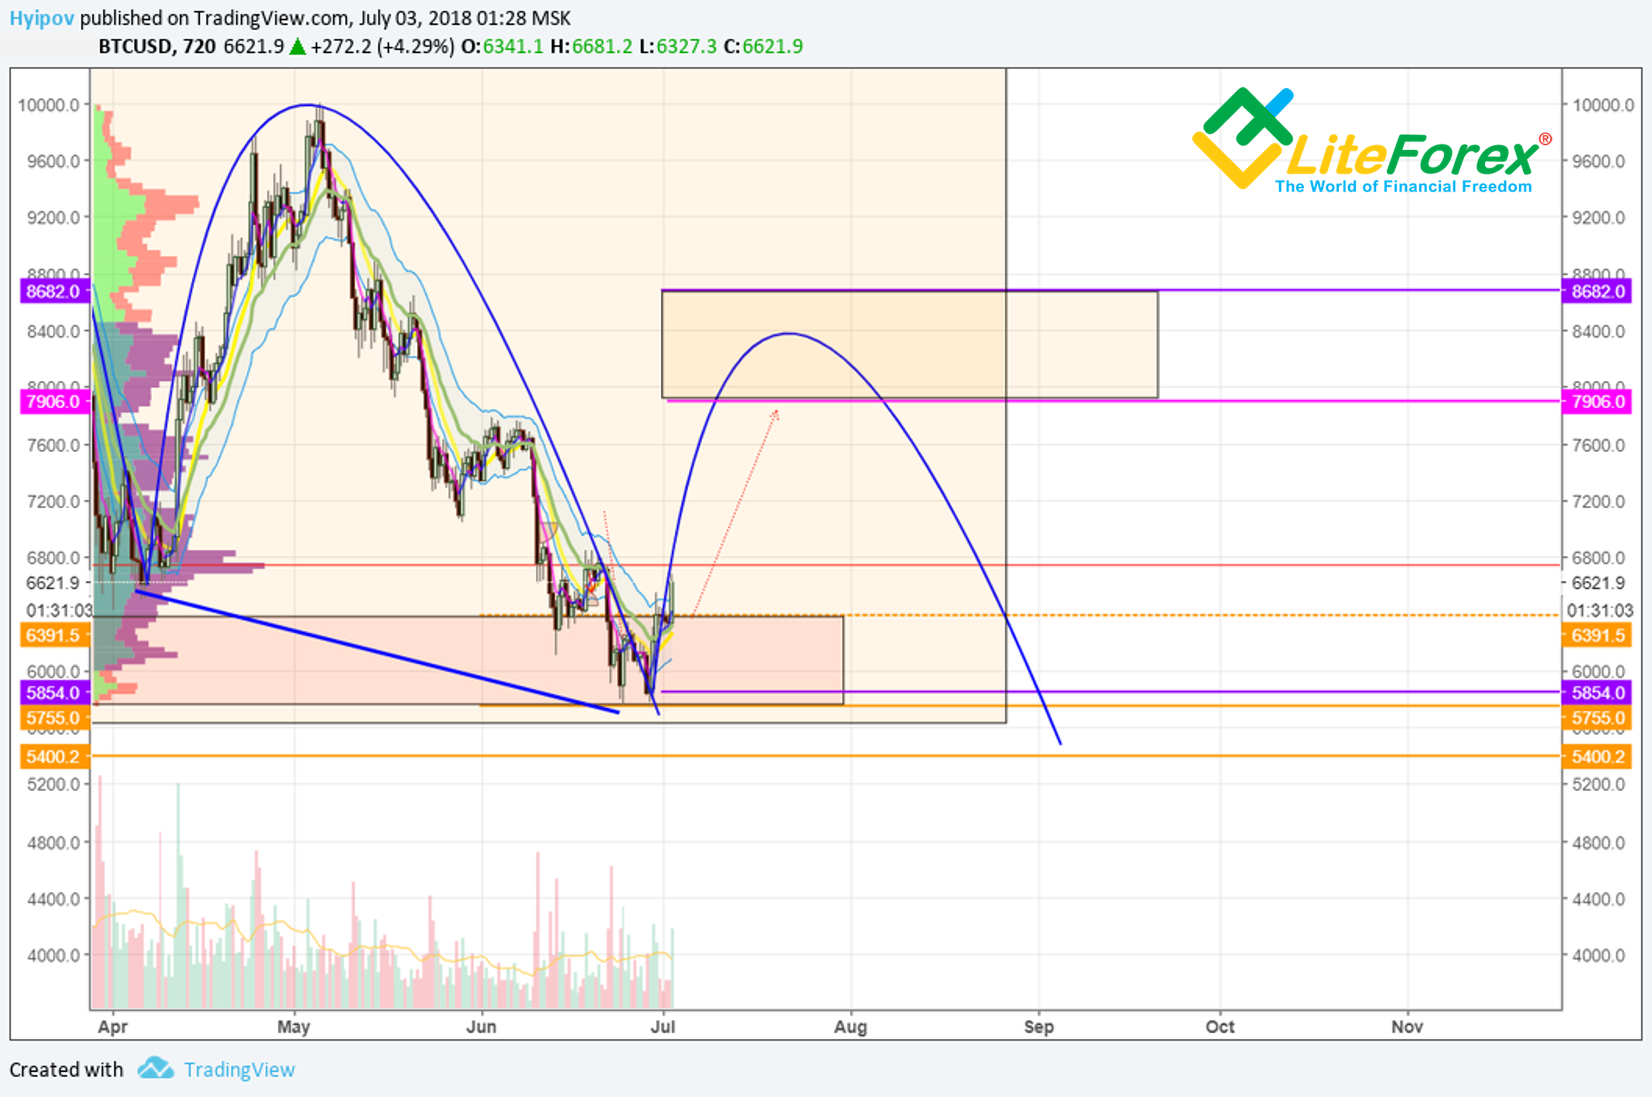
And compare it with the picture that we are seeing now (see the chart below), it is clear that in general we are going within the scenario described.
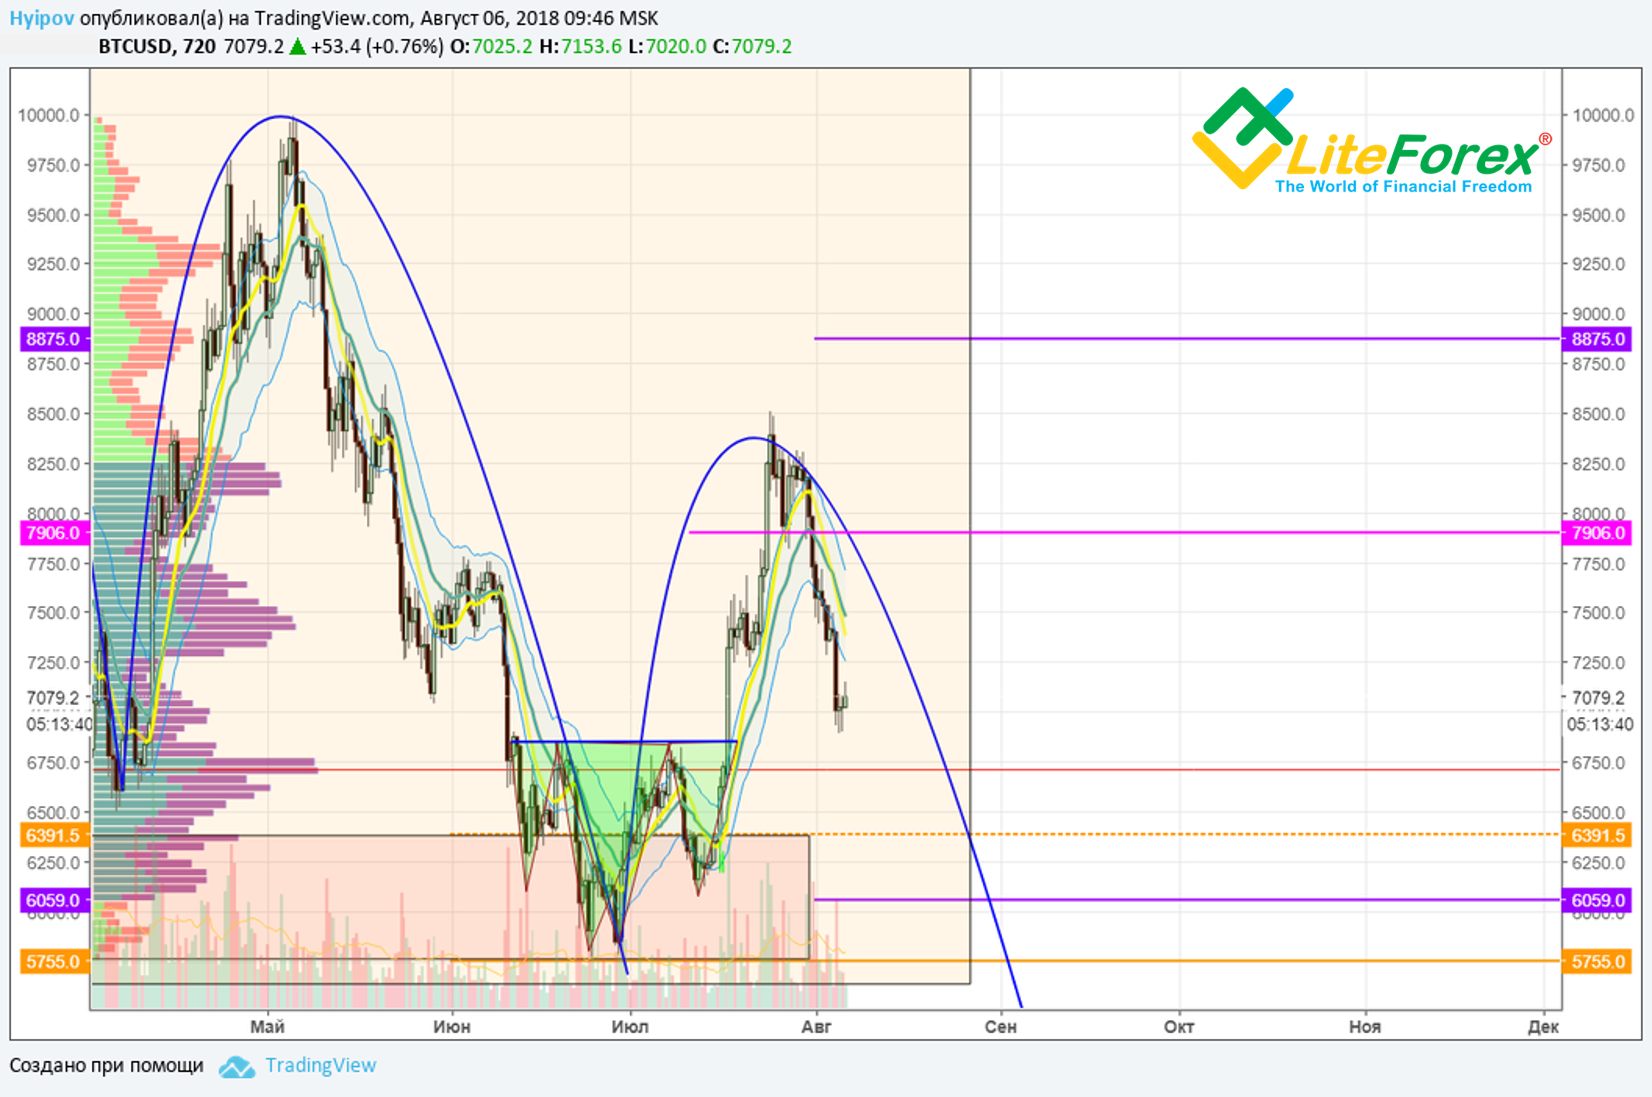
From the fundamental point of view, there were practically no changes for bitcoin, except for the hyped up sensation around the ETF.
My global view of Bitcoin has not changed over this time. I outlined it in detail in the BTC/USD analysis dated July 11 and still believe that there are no fundamental reasons for the bitcoin to update the bottom, and each correction can be considered as a new opportunity to buy the crypto currency at a discount.
At the moment, as seen from the btc chart above, we are just in such a correction. And the main issue now is where this decline will stop.
To determine this value, I suggest doing our traditional panoramic technical analysis of BTC to determine the prospects.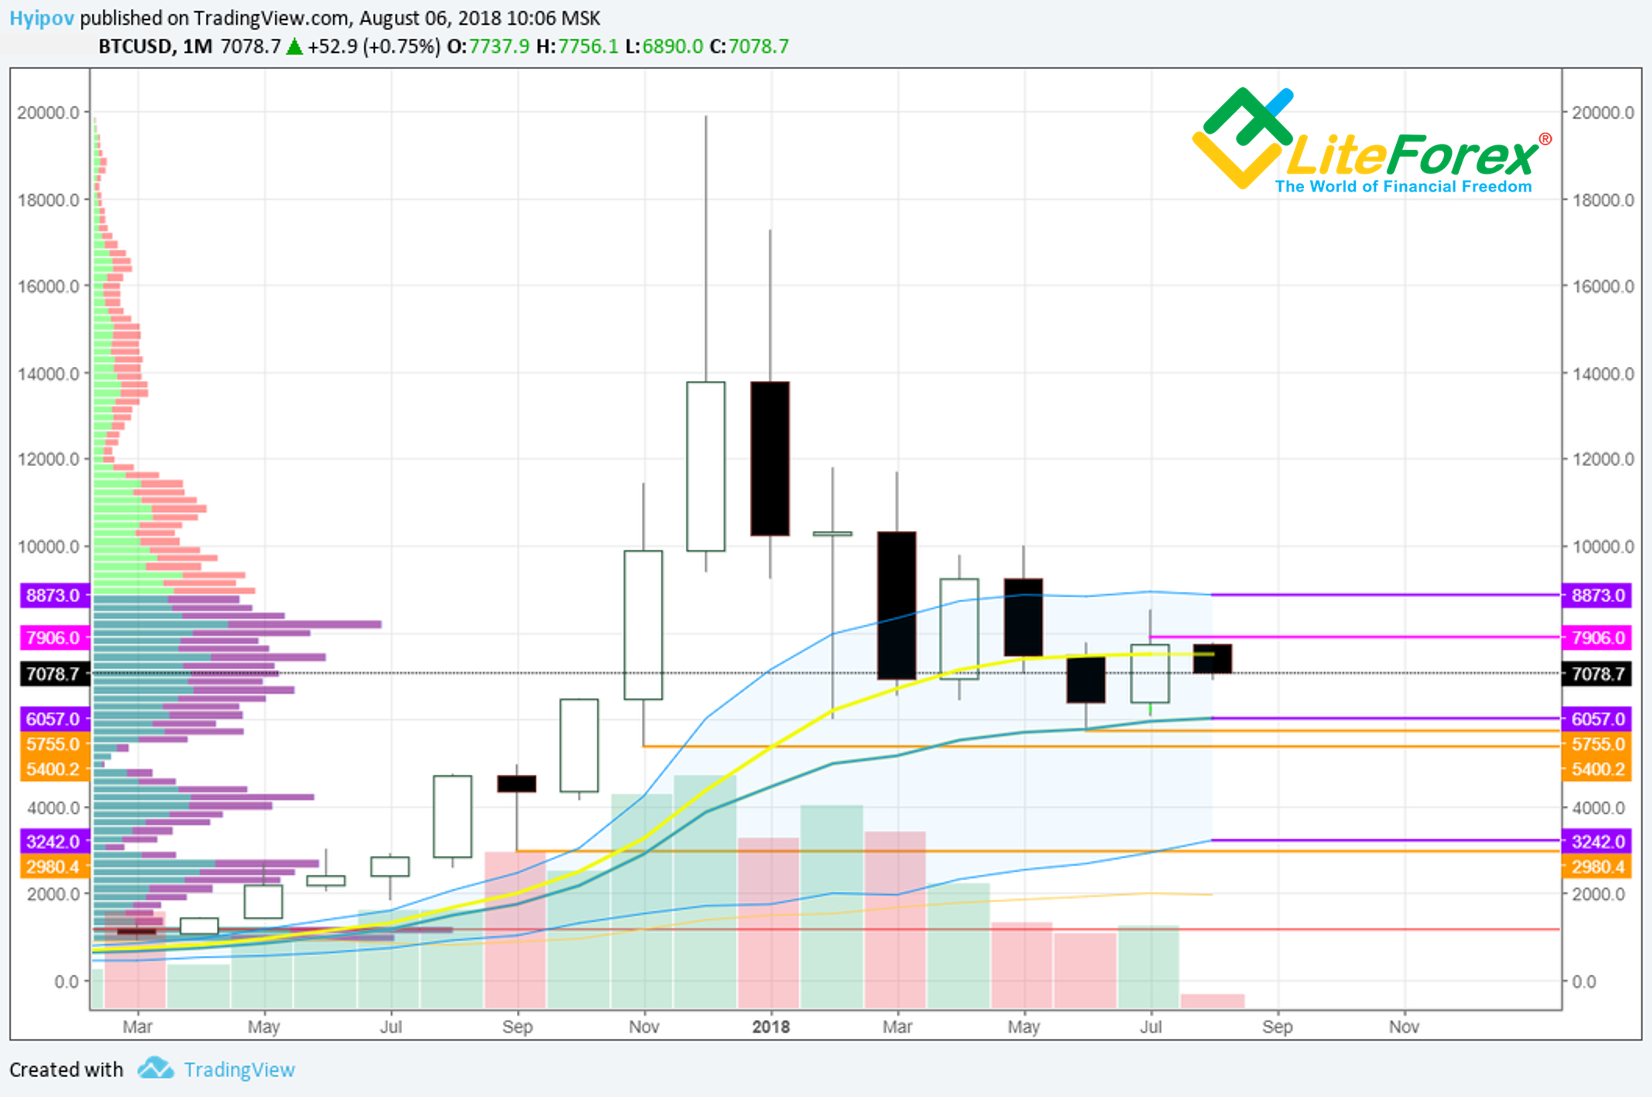
In a monthly BTC/USD chart, we see how the July candle has covered the body of the candle of the previous month. In this case, the local lows of June in July were not tested, and the highs were broken.
All this action was within the upper half of the Keltner channel with a rebound from its midline, which is also a positive signal.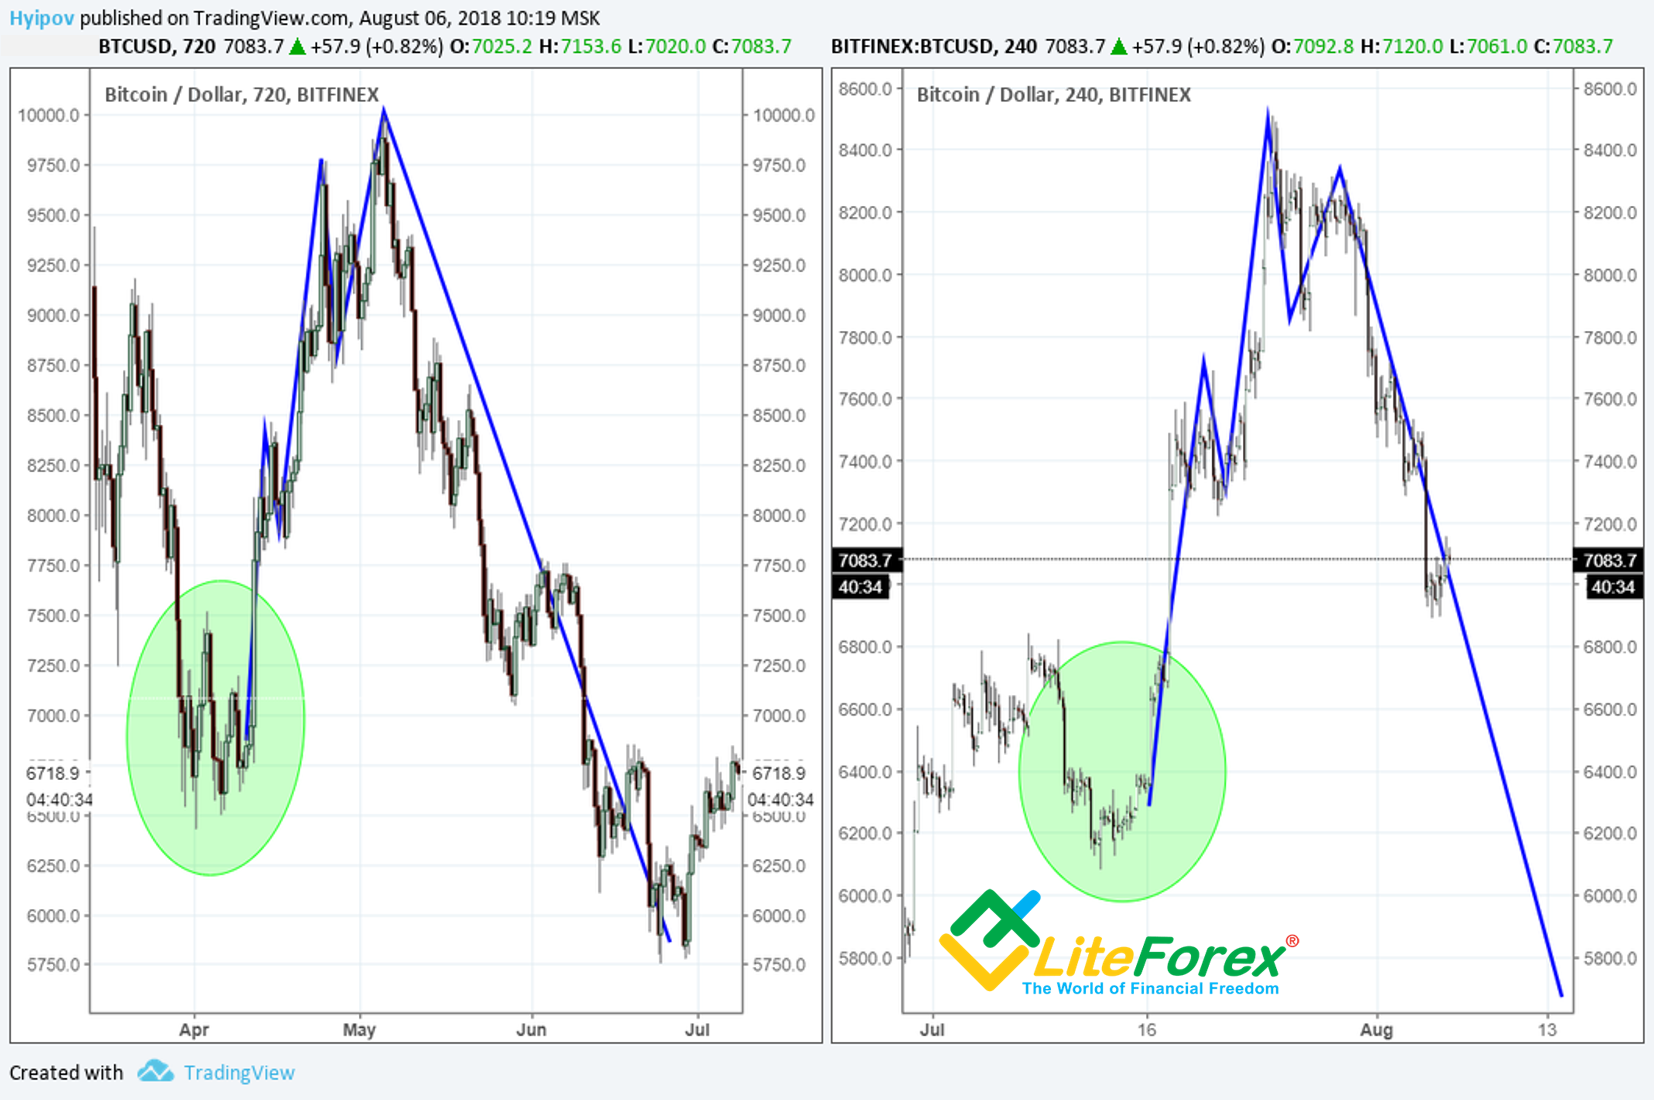
To my surprise, many compare the current situation with the one that unfolded in April and, based on this pattern, suggest further development of the correction.
However, these two situations have a fundamental difference.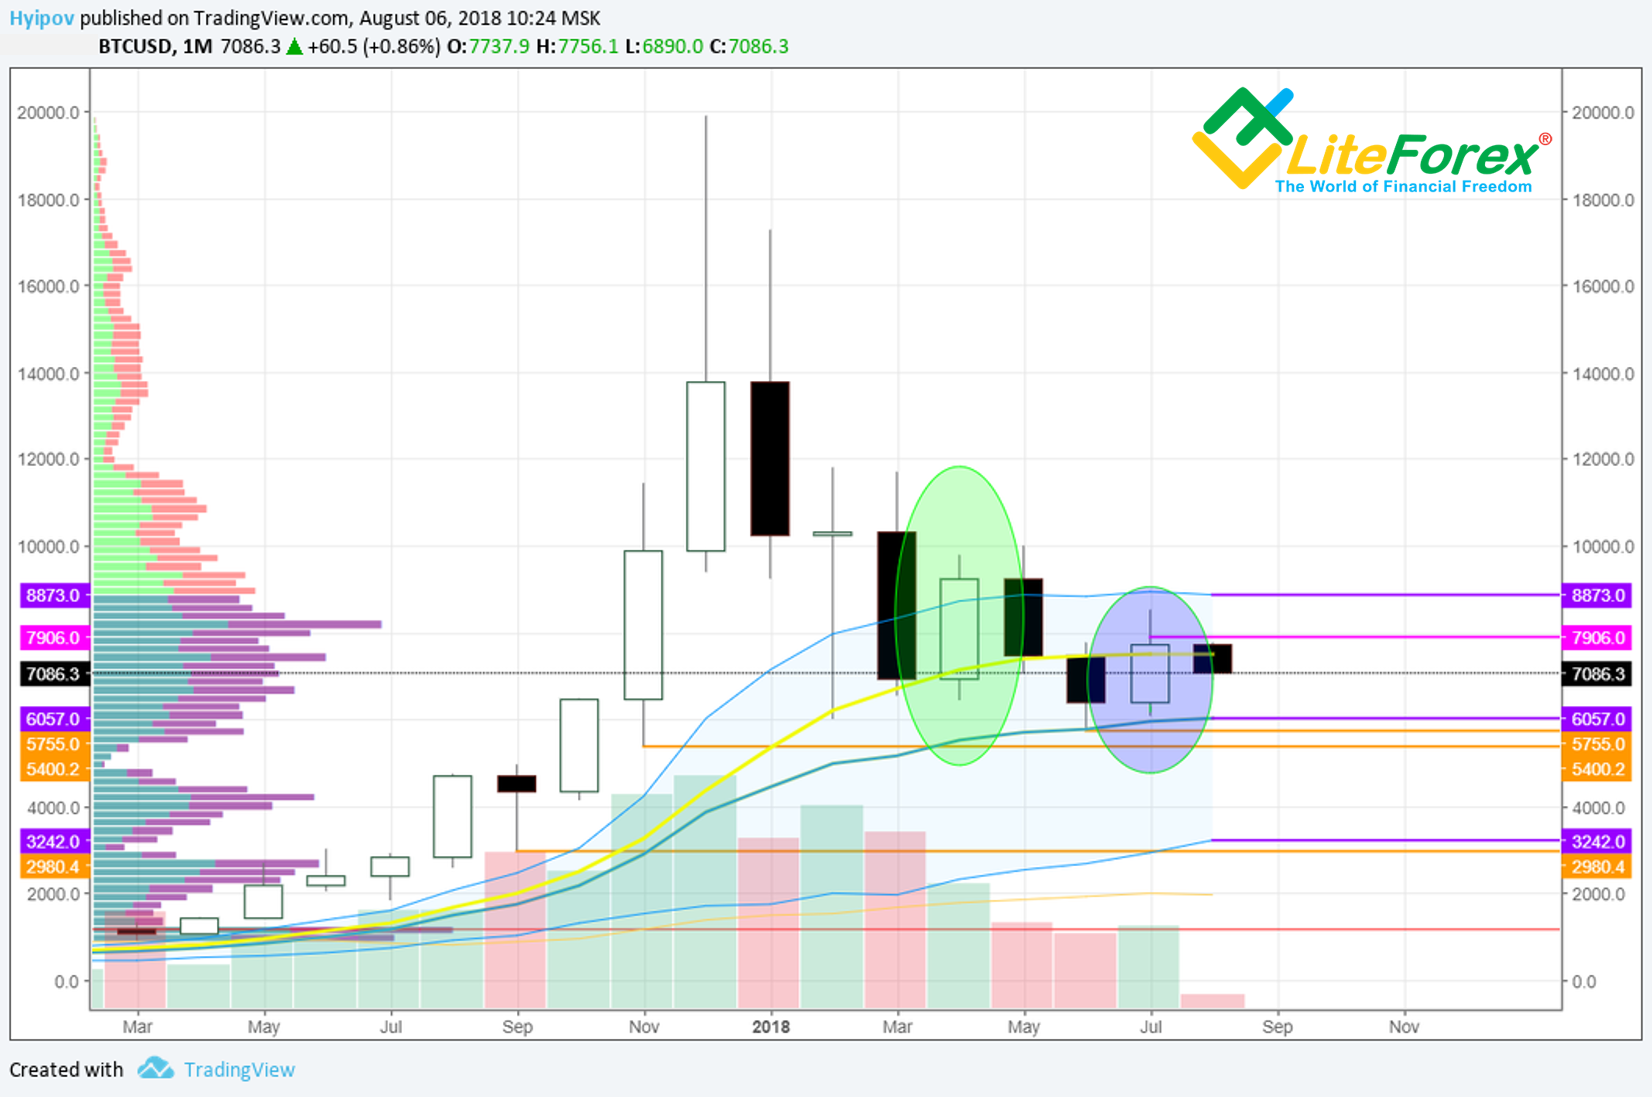
The April candle could not reach the highs of the previous candle, but at the same time it renewed its lows. These signals are bearish and give the prerequisites for the continuation of the movement. Moreover, we see that this white candle appeared within the bearish trend, which only entered the zone of the Keltner channel and has not yet reached the equilibrium level. The July candle here is in a diametrically opposite position.
It was formed after the rebound from the middle channel of Keltner. Well, above I have already talked about the broken highs and untouched lows.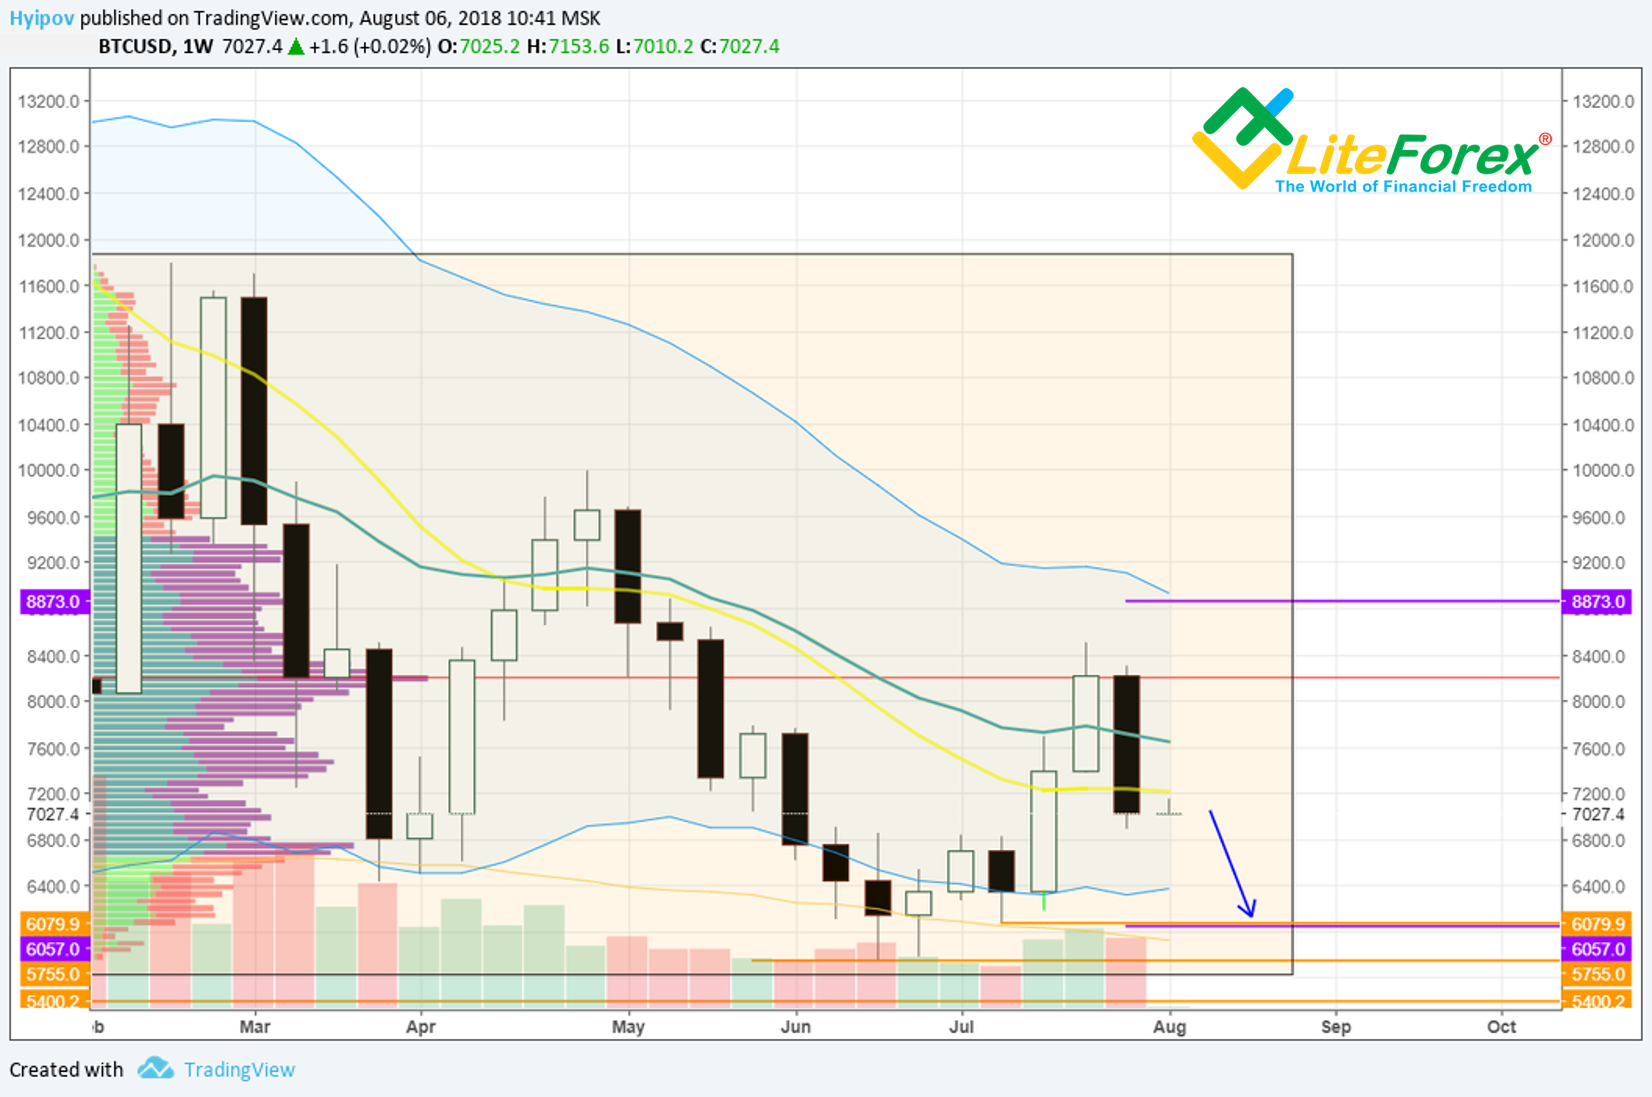
Considering the above, a correction of bitcoin within the last month is possible with a possible retest of the last July low at 6079 USD.
As you can see, this value almost exactly falls on the current level of the Keltner middle line, because here a strong support for the bulls is expected.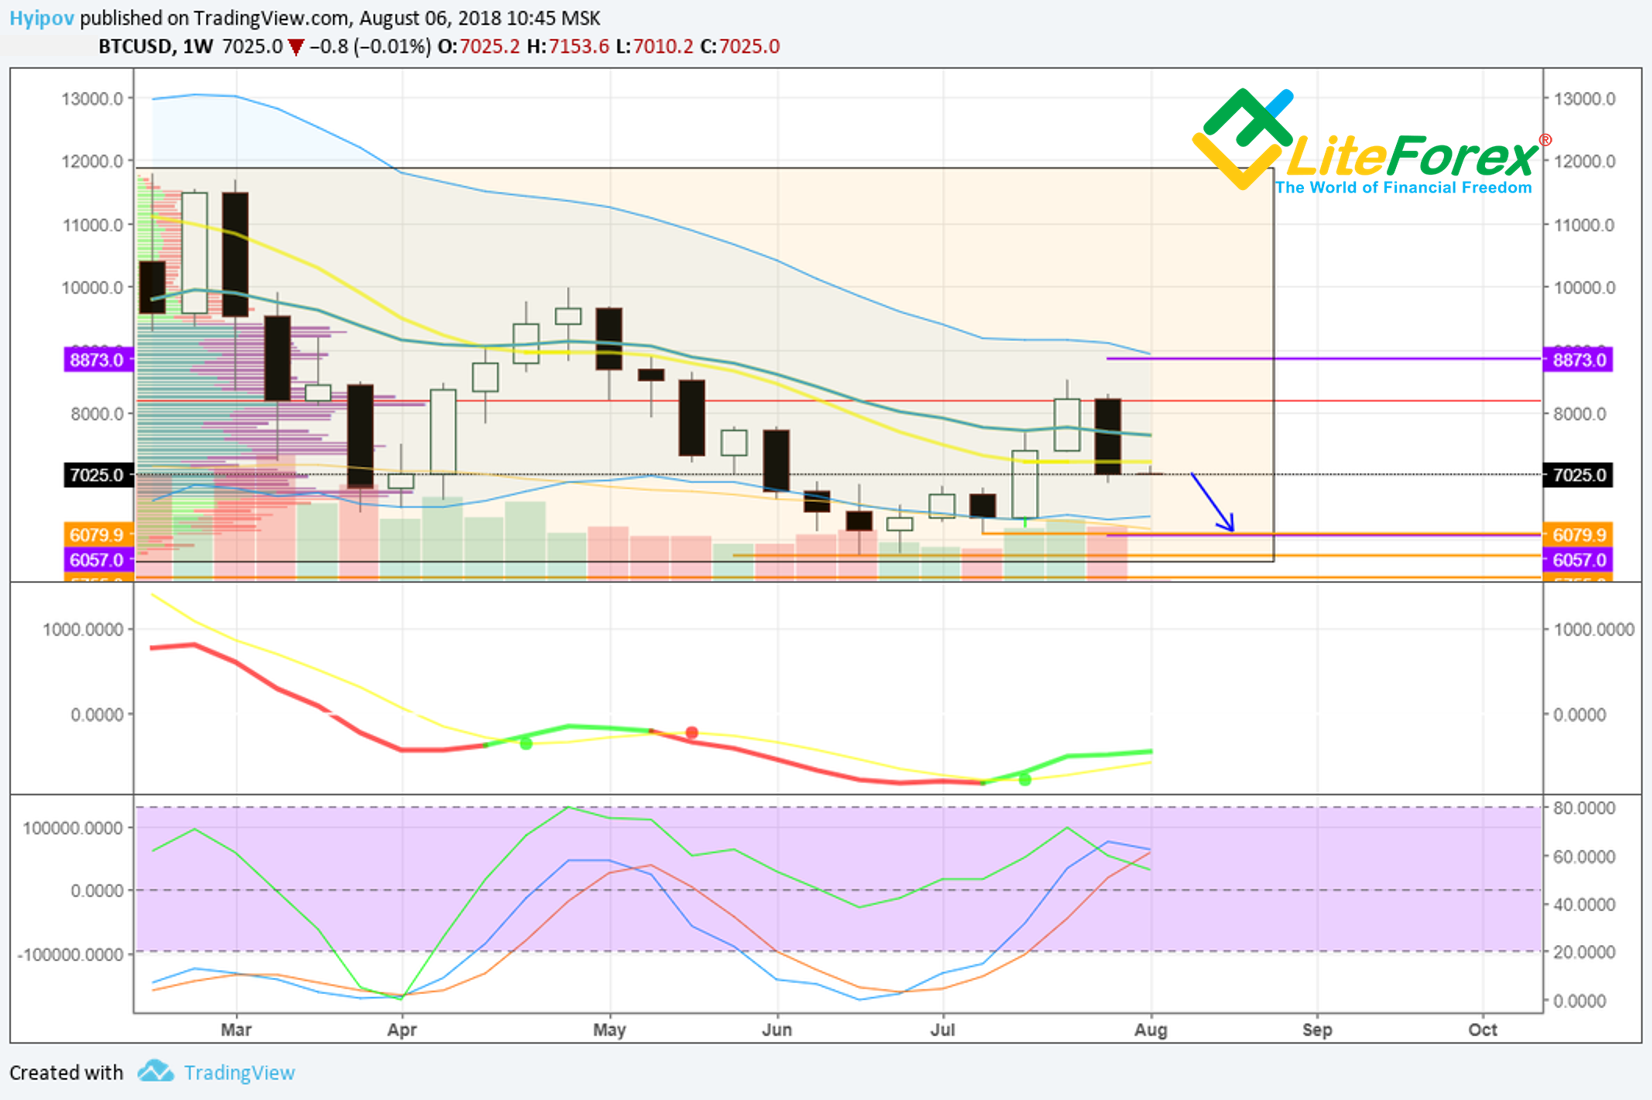
Oscillators do not contradict the bearish sentiment. In the indicator windows, we do not observe any obvious reversal signals in the form of divergences or convergences, which indirectly indicates the probability of continuing correction within the specified range.
Now let's look at the daily chart.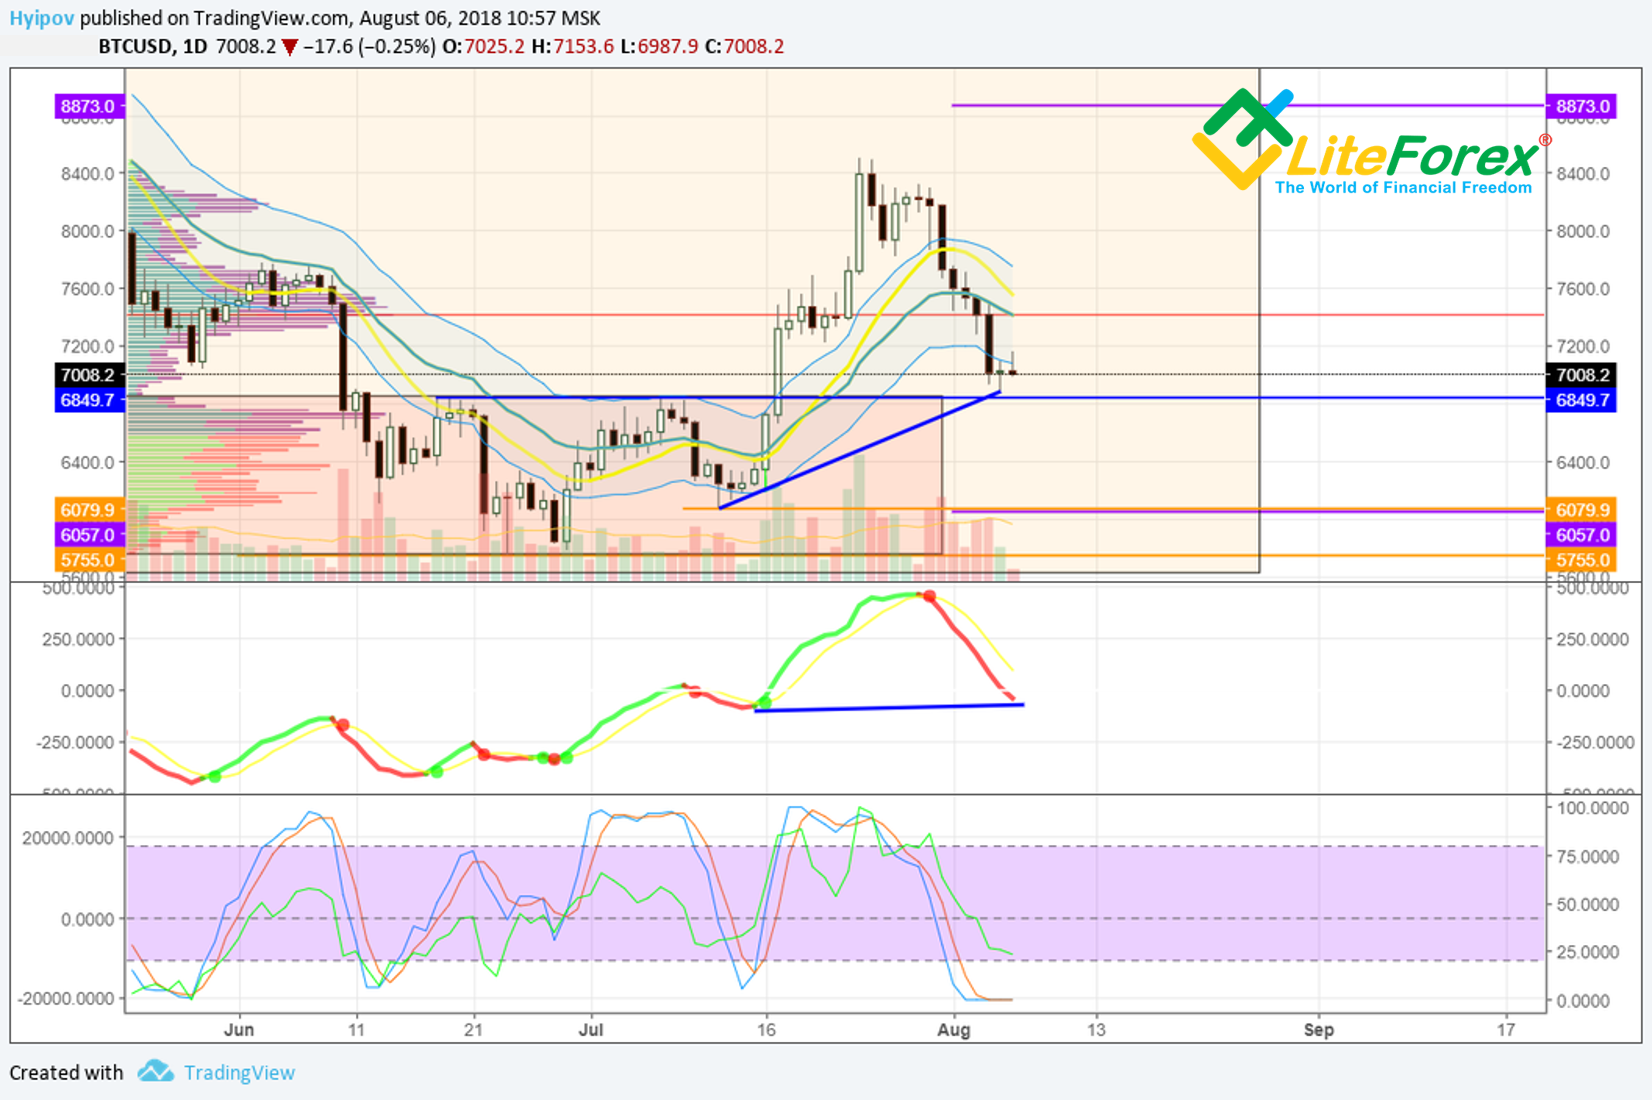
We see that the current correction closed the last level around 6850, thus confirming support for these values.
In doing so, we see a hidden divergence in moving average MACD and Stochastic RSI lying at the bottom of the oversold zone.
If you recall the course on fractal analysis, which I published earlier this year, then we have the primary signs for the formation of the first element of the fractal pattern Origin:
1. We observe an impulse growth after the bearish trend
2. Confirmation signal of bullish divergence
3. The rollback of the impulse should not cross Fibonacci 0.236 from the length of the wave itself?
At the moment, the third point remains a stumbling block.
To preserve the bullish fractal pattern, the correction should not fall below 6642 USD (where the same Fibonacci 0.236 of the total impulse length)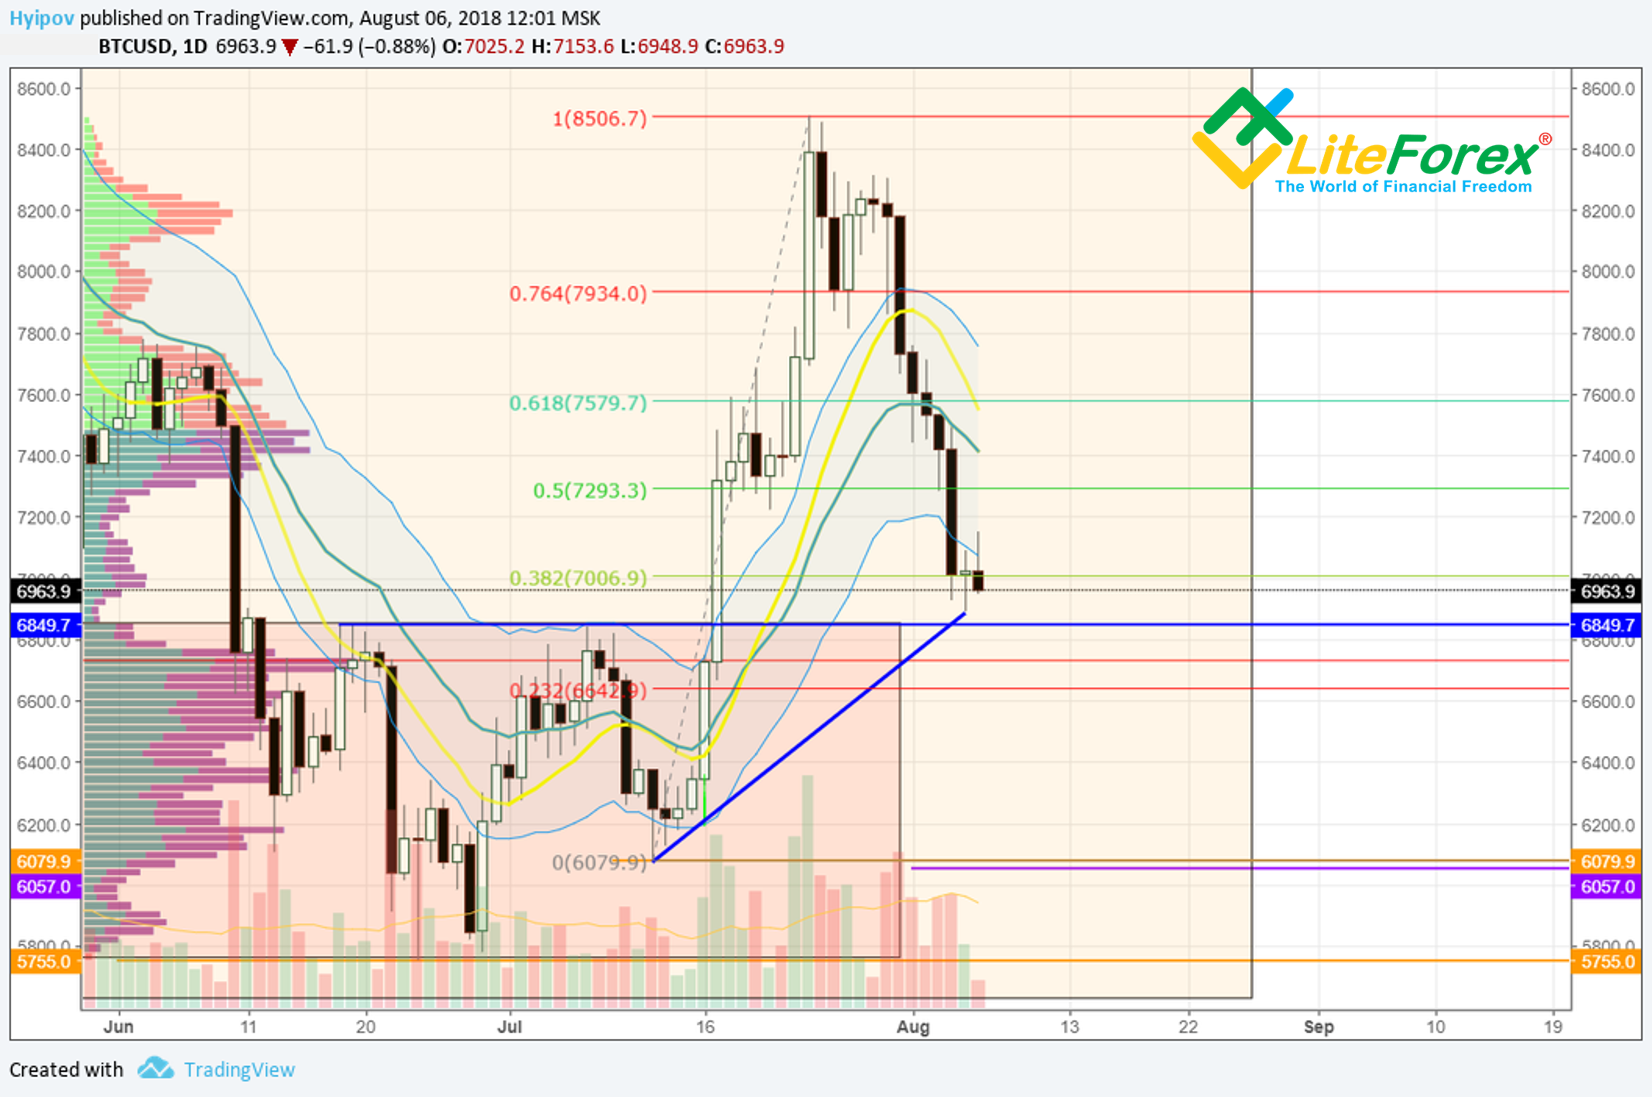
If we look at the chart above, we see that it is within reach of this value, which means there are serious risks of breaking of the bullish model.
If the penetration of this value occurs, it will certainly not be a catastrophe, nevertheless, a decrease to 6000 with a further rebound is not quite what the bulls would like to see, since in this case the development of the bullish trend will be greatly delayed and will undergo a painful sideways movement.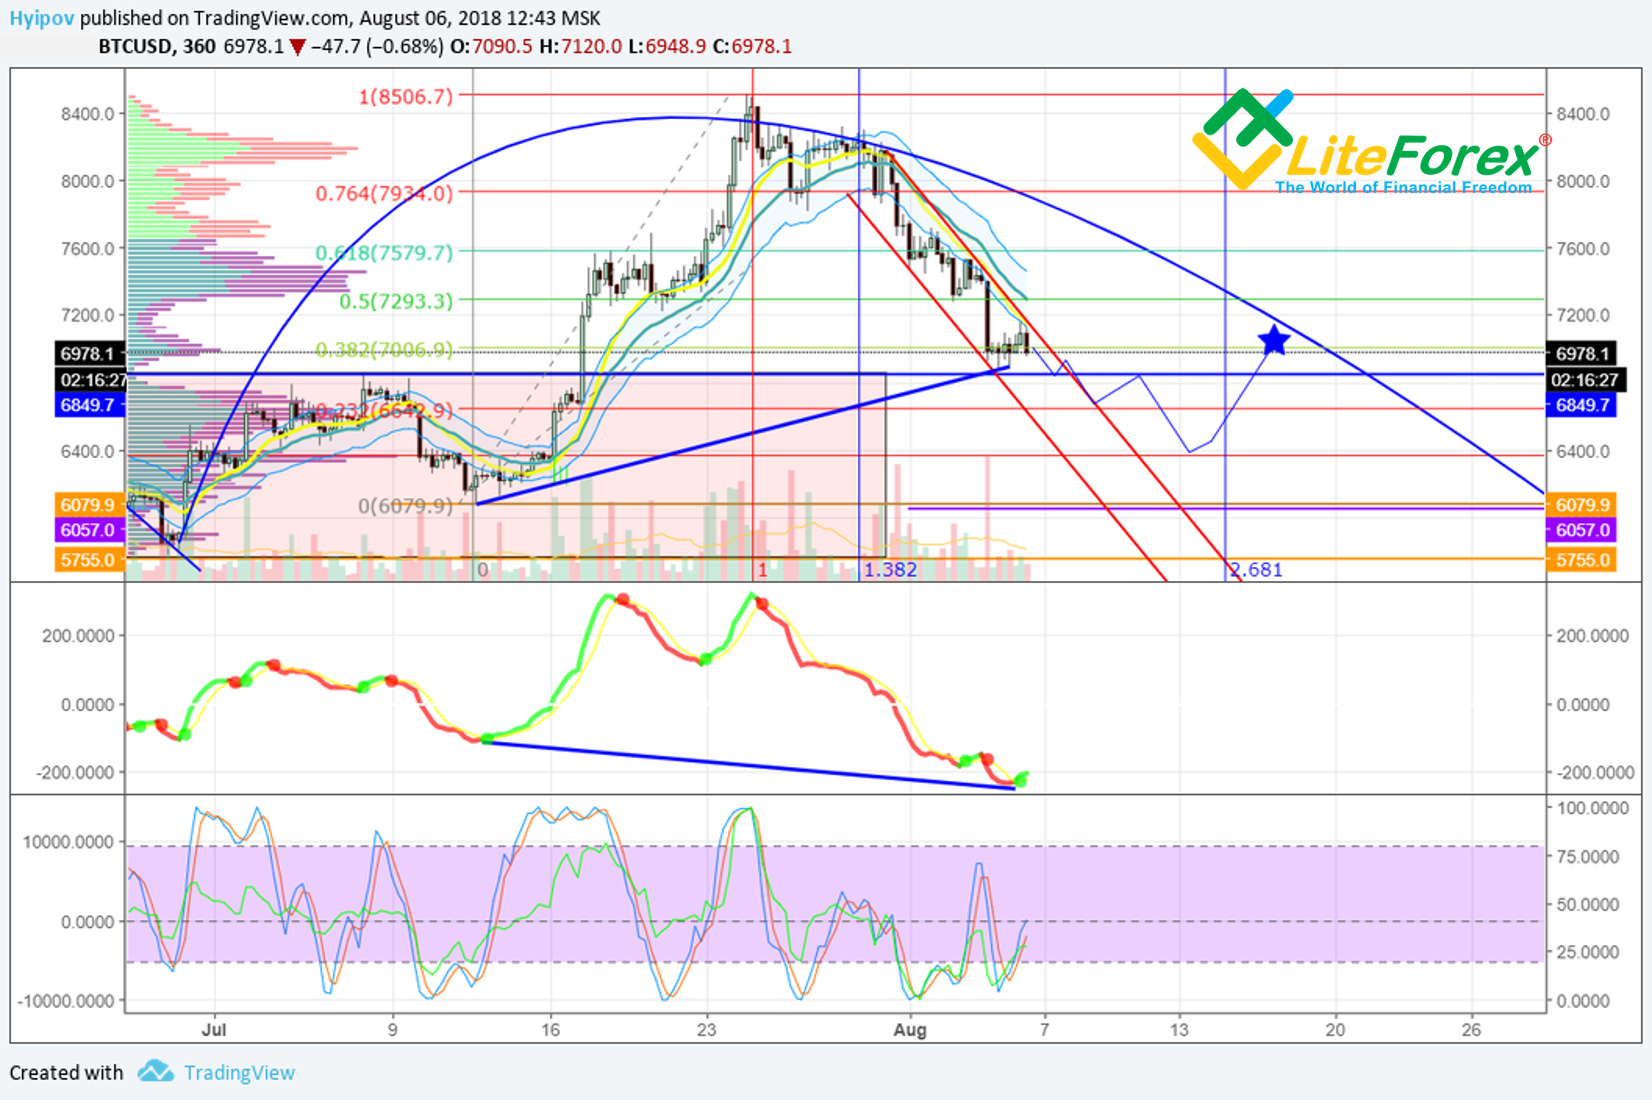
In BTC/USD 6-hour chart, the bearish local channel within which the movement occurs is obvious. The first sign for consolidation and potential reversal will be the exit from this zone, marked in the chart by two red lines. We haven't seen it yet, so it indicates a probable attempt in the future to break the current values.
On MACD, the hidden bullish divergence is much more pronounced, however, this only indicates the increasing potential of the bulls, but not the end of the correction.
Summary
With a high degree of probability, the manipulator will try once again to confuse everyone and break through the key 0.224 level to 6642 USD, which will expand its space for future maneuvers.
A strong support level will be the zone in 6080 - 6400, from which I expect a rebound in the global cycle.
Further developments around bitcoin in this case are in the form of consolidation with the formation of an equilateral triangle (see the chart below)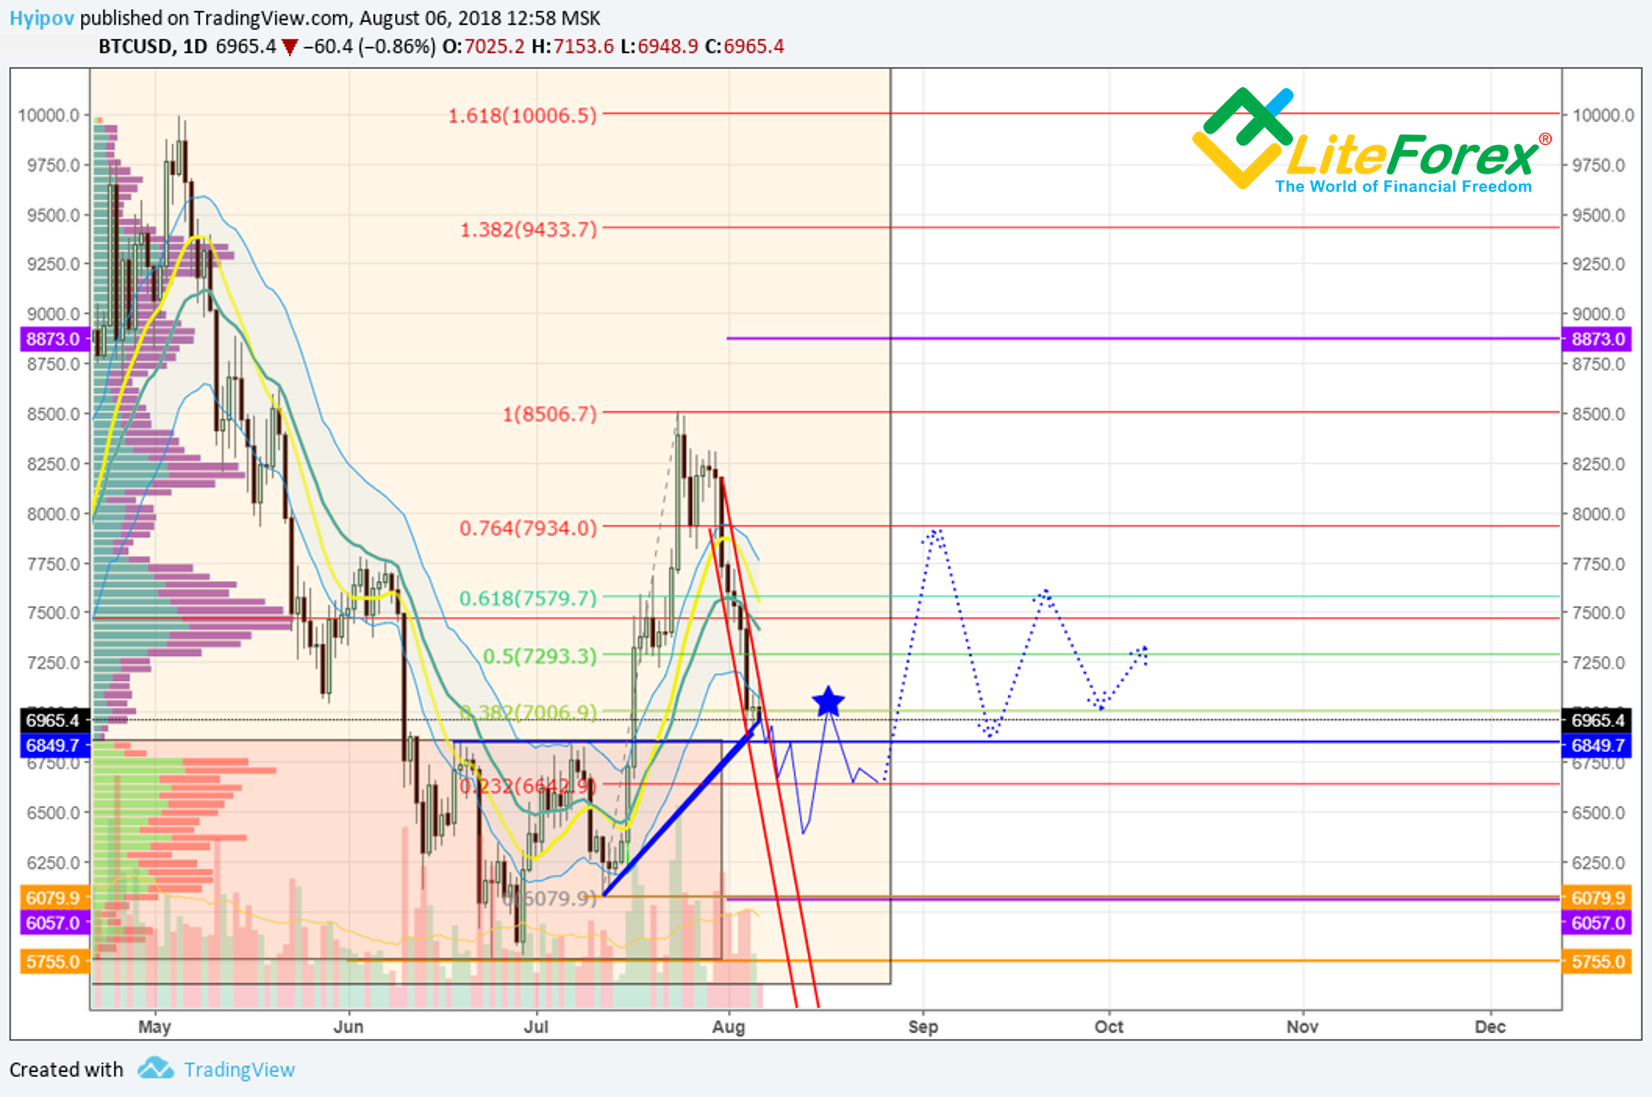
An alternative bullish scenario that is shaping out in the case of a rebound from 6642 is schematically illustrated below.
In this case, the Origin element will be confirmed. Its second peak is usually higher than the first.
Then a trident will be formed, which will form the basis for the bullish impulse to the upper limits of the trading range.
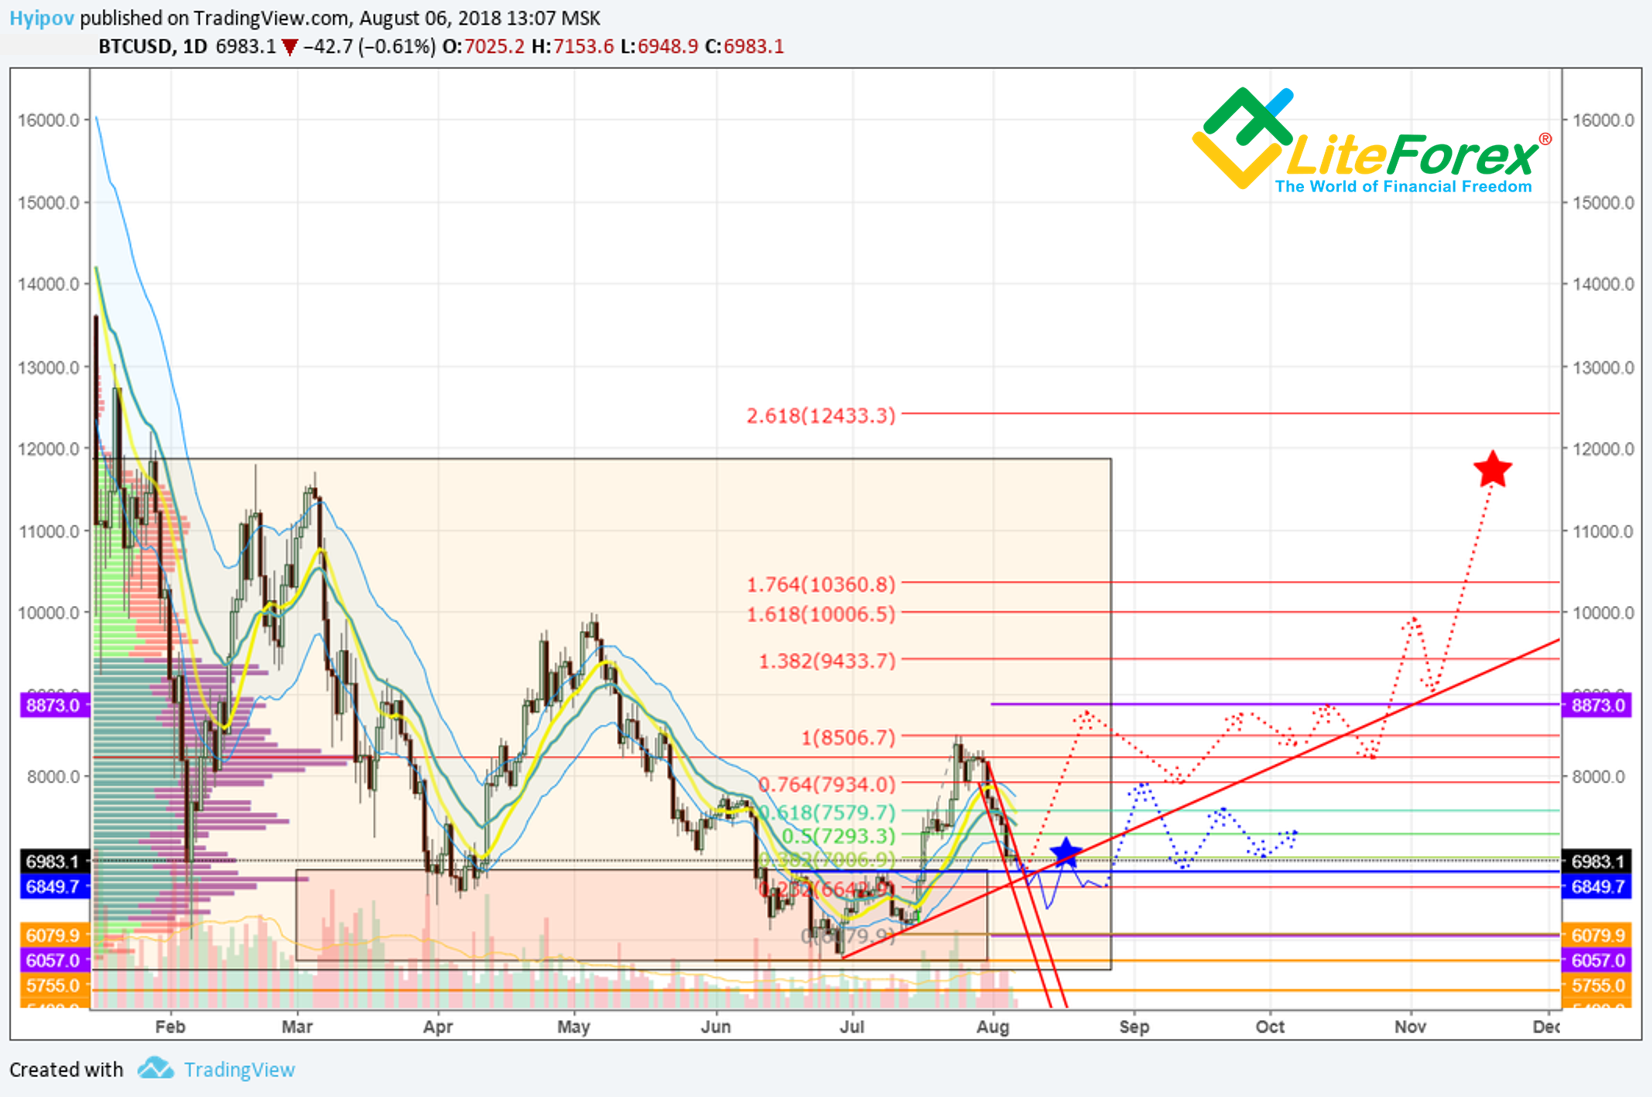
The scenario with the breaking through of the July lows should not be considered for the time being, since I do not see any fundamental grounds for the development of such a scenario for bitcoin.
This is my alternative scenario for BTC/USD for the nearest time.
Best regards,
Mikhail @Hyipov
PS: If you agree with the forecast, leave a "+" in the comments to this post, if you do not agree, leave a "-". If you liked the post, leave a few words of gratitude and do not forget to share it with your friends.
Stay tuned to the latest developments in the crypto currency world, follow my publications in my blog.
