The Stock Exchange is all about trading. Each week, we do the following:
- feature advise from top traders and writers, and provide a few (minority) reactions from fundamental analysts.
We also have some fun. We welcome comments, links and ideas to help us improve this resource for traders. If you have some ideas, please join in!
Review: How Big Will The Next Market Pullback Be?
Our previous Stock Exchange asked the question: How Big Will the Next Market Pullback Be? We noted that many traders wait patiently for the next market sell off because it creates an opportunity to “buy low.” However, how low is low enough? How far does the market have to fall before it officially becomes a buying opportunity? Traders run the risk of being too early (e.g. the market could fall a lot farther) or too late (e.g. they miss the buying opportunity because they were waiting for the market to fall just a little farther before entering a position).
This Week: ETFs Kill Fundamentals, Technicals Matter
This week we tease the idea that growth in passive ETF investing is killing the appreciation for fundamental analysis, and increasing the importance of paying attention to technical analysis when placing trades.
For starters, here is a fun chart from @zerohedge showing that passive investing continues to grow rapidly.
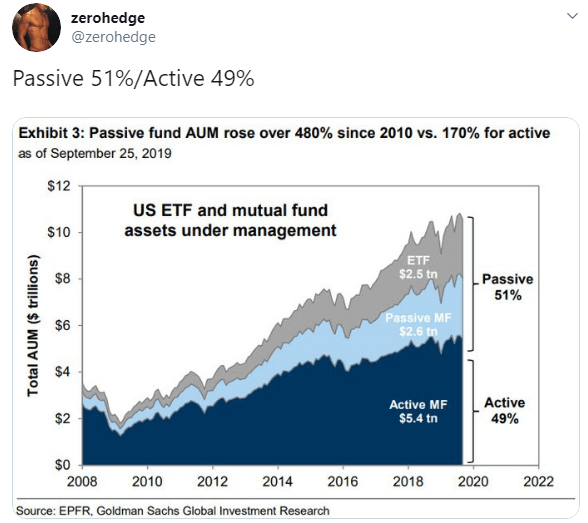
Now aside from active mutual fund managers complaining about the dangers of this trend (on the inside they’re complaining about their lower AUM revenues), there are implications worth considering.
One of the commonly mentioned dangers of this trend is that it leads to bloated large cap stock market caps, because many cap weighted ETFs end up buying more and more large cap stocks in a bit of dangerous cycle. Arguably, this trend causes stock prices to detach from fundamentals.
However, rather than arguing about the dangers of the ETF growth trend, some argue that it simply creates more opportunity for technical traders considering stocks are arguably moving less on fundamentals, and more on technicals.
For some perspective, here is a look at the September, Q3 and year-to-date performance of major market indeces, sectors and styles (and of course there is a growing amount of assets being allocating to ETFs that closely track each of these categories).
September 2019 Performance:
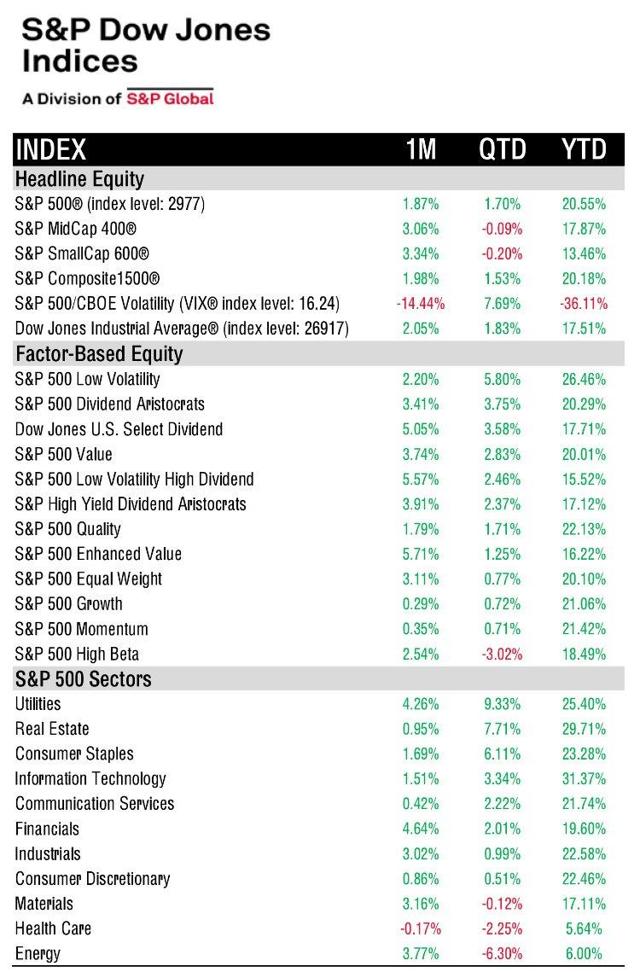
Right before the Tech Bubble started to burst in early 2000, many investors where claiming that tech stocks were not overpriced because “this time it is different.” We know how that ended. However, a look at that table above shows the Technology sector continues to dominate all other categories this year, because, well, this time is different?
And the table and pie chart below shows that as of September 30, 2019, Technology is again the biggest sector by an increasingly wide margin, and it happens to be dominated by some very large technology stocks (worth mentioning, calling Amazon (NASDAQ:AMZN) and Facebook (NASDAQ:FB) something other than Tech is a little absurd considering Amazon Web Services dominates Amazon and seems like more of a tech business than Consumer Discretionary, and calling Facebook Communication Services is a new thing that seems a little odd too).
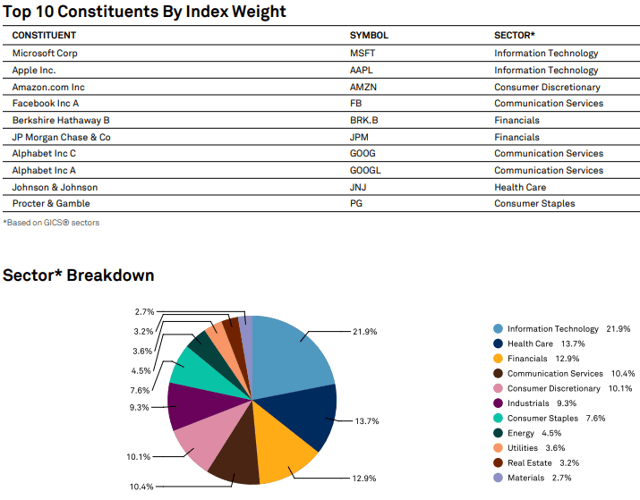
(image source: S&P Dow Jones Indices)
Nonetheless, as ETF assets grow, it certainly impacts stock price correlations, and it makes technicals (for example, momentum) increasing important and worth considering when placing any trades. We consider a variety of technical trades in the next section of this report.
Expert Picks From The Models
Note: This week’s Stock Exchange is being edited by Blue Harbinger. Blue Harbinger is a source for independent investment ideas.
Holmes: I bought shares of Inphi Corp (IPHI) on 09/23 for $58.53, and then sold them on 09/24 for $62.95.
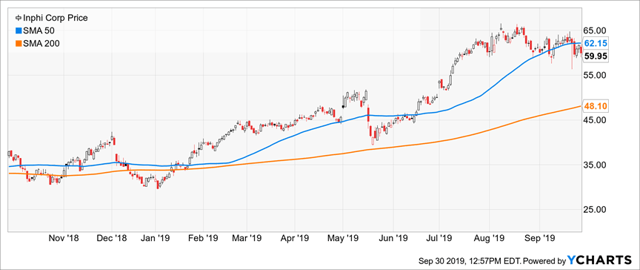
Blue Harbinger: That’s a quick round trip trade, Holmes. I assume this was based on the technical market conditions?
Holmes: Yep. I am a computer based trading model. Generally speaking, I am a dip-buyer, and this one worked out in my favor quickly.
Blue Harbinger: Do you even know that Inphi is semiconductor stock? The company is headquartered in Santa Clara California. Here is a look at the F.A.S.T. Graph.
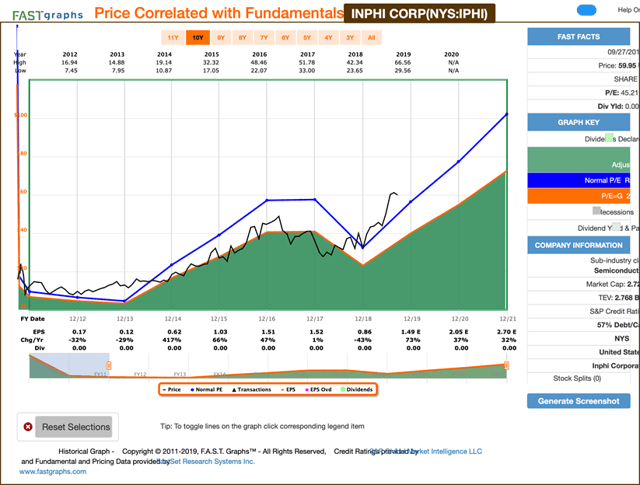
Holmes: Yes, I am aware. But that’s not why I traded it. I usually hold my positions for around 6-weeks, but this one worked out much quicker.
BH: Well, it looks like this one capitulated a bit around its 50-day moving average (based on your chart). Thanks for sharing. And how about you, Road Runner–any technical trades to share with us this week?
Road Runner: I bought Lululemon (NASDAQ:LULU) on 9/23.
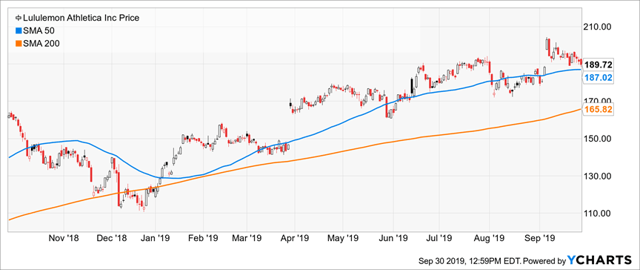
BH: Well–I know you are a technical trading model, so I am assuming you didn’t buy because you like Lululemon athletic clothes, correct?
RR: Correct. I bought because my technical trading program is based on buying stocks in the lower end of a rising channel, and then holding them for around 4 weeks. You can see what I am talking about in the following chart.
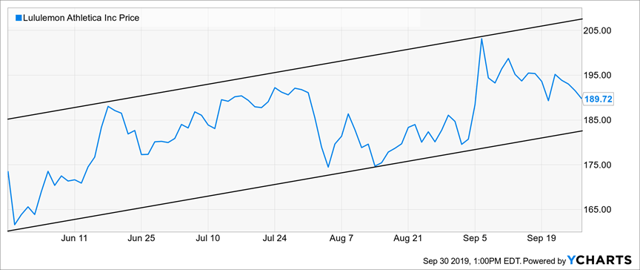
BH: I do see the channel you’re talking about. But how can you trade without even considering the fundamentals?
RR: I can appreciate your concerns, but technical trading is an entirely different approach to the markets. You can request more info from Jeff using the link near the end of this report.
Emerald Bay: While you try to walk BH through the concept of technical trading, I have another technical trade for our readers to consider. I bought shares of Martin Marietta Materials (NYSE:MLM) on 9/18.
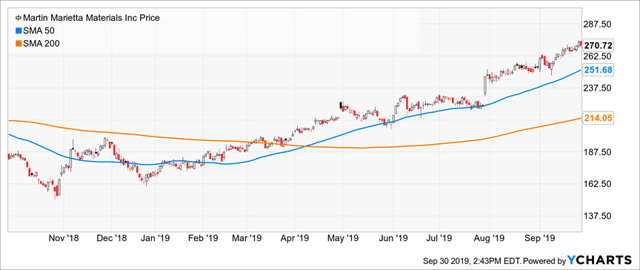
BH: Okay. I’m assuming you also bought for technical reasons? This is a building materials company, by the way.
Emerald Bay: I know what the company does. And yes, I did pay close attention to the technicals on this one. I am mainly a momentum trader, and I like to base my position sizes on volatility with more capital invested in the less-volatile stocks.
BH: Well I can see the momentum in this one. It’s been on fire this year, and it is easily outpacing the materials sector, which is up only 17.1% so far this year (as we saw in the earlier S&P table). I guess, based on its deviating outperformance versus the materials sector, it’s NOT safe to say everything just trades like the ETFs it’s lumped into. There are some outliers.
EB: No kidding. There’s a lot more to technical analysis than just monitoring passive sector ETFs. That’s how we find opportunities like MLM.
Conclusion
Businesses and industries change and evolve a lot quicker than they did back in 1934 when Ben Graham wrote his first edition of Security Analysis (a book many investors consider the “investing bible). And technical analysis, an approach that fundamentalists often turn up their noses to, may be becoming increasingly important as markets move faster and are increasingly driven by passive ETF investing. However, to suggest that passive ETF investing has killed the need for fundamental analysis is a little absurd. Nonetheless, technicals are becoming increasingly important to many investors and traders alike. Have your trading strategies evolved as passive ETFs continue to comprise an increasingly large percentage of market wide investment dollars?
