The Internet buzzes with predictions for the next bear market. Some use fundamental analysis to make their case. For instance, Shiller’s cyclically-adjusted price-to-earnings ratio for U.S. equities (PE 10) employs 10 years of trailing corporate profits. It currently stands at 25.6, while the historical average is roughly 16.5. This suggests that if U.S. large-cap stocks experienced a regression to the mean, they would collectively fall 36%.
Others use contrarian data. For example, Investors Intelligence regularly surveys financial professionals to determine the percentage of bullish and bearish advisers. The weekly poll (6/4/14) found that 62.2% were bullish, while 17.4% described themselves as bearish. The bull-bear spread of 44.8 is far higher than the long-term average spread of 15. The current level is also near highs seen at previous market tops — 42 in October of 2007 and 42 in April of 2011.
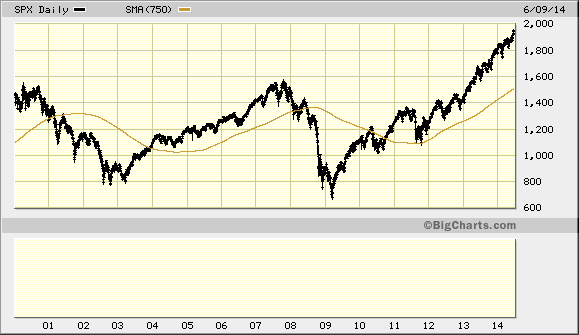
Still others favor technical chart patterns. For instance, the S&P 500 is further above its 3-year (750-day) trendline than at the start of previous bears — March 2000 and October 2007. Technical analysts often use uncharacteristically large percentages above trendlines, or simple-moving averages, to determine the likelihood of a mean reversion. A regression to the 3-year simple moving average would constitute a 23% bearish sell-off.
When stocks revert toward a mean, however, the adjustment is far from exact. Bear markets tend to overshoot long-term averages. Indeed, the S&P 500 did not just pull back to the 3-year simple moving average in the technology-led bear (2000-2002) or the financial collapse (2007-2009); the benchmark dropped far below the trendline and buy-n-holders endured 50% declines twice in a single decade. Similarly, PE 10 for the S&P 500 may have peaked at 27.5 in mid-2007. Yet the regression toward the mean dropped below the long-term average of 16.5, falling all the way to 13.3. It follows that a bearish decline could easily fall far below a fundamental, contrarian or technical mid-point.
In making these observations, one might conclude that I am seated in the bearish camp or that I am predicting an imminent severe stock shock. On the contrary. My Pacific Park Financial clients remain fully invested at respective targets for equity exposure. For one thing, late stage bull markets can carry on for months, even years, regardless of whether the price appreciation is rational or irrational. Secondly, there are a variety of ways to mitigate the risks associated with participation.
Here are three tools that I use when stock valuations are elevated and when adviser optimism hits extremes:
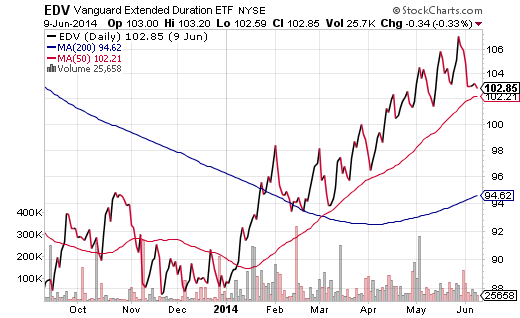
1. Revisit the Barbell. More often than not, I choose assets all along the proverbial risk spectrum. Investment-grade corporates, high-yielding corporates, preferreds, convertibles, MLPs, REITs — income production might come from a variety of sources. When several indicators suggest that stocks might be at risk for a significant setback, though, I may slim down on assets in the middle of the risk scale and/or acquire more assets that have a reputation for being on the far left of the barbell (a.k.a “risk-free” or “risk-off.”) At the start of the year, I added longer-duration investment grade vehicles like Vanguard Extended Duration Trust (NYSE:EDV) or Vanguard Long Term Bond (ARCA:BLV).
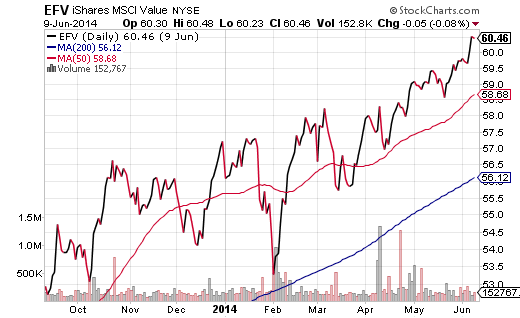
2. Lower Valuations in Established Uptrends. Another method for reducing risk is picking up “less expensive” stock ETFs that have been confirmed by technical indicators. Reasonable valuations are tough to come by on the domestic front. Nevertheless, the trailing 12-month P/E for FirstTrust Technology Dividend (NASDAQ:TDIV) is a reasonable 15.5 and the current price is above key trendlines (e.g., 50-day, 200-day, etc.). Even better, you can diversify risk by incorporating foreign stock ETFs. Nearly all of them are cheaper on a price-to-earnings basis. Many of them have built solid uptrends. And the trailing 12-month P/E for iShares MSCI Value (NYSE:EFV) is approximately 13. That represents a 25%-30% discount to the S&P 500.
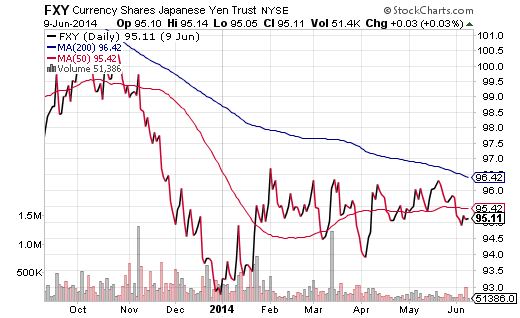
3. Hedging With Negatively Correlated Assets. In earlier commentary about the Japanese Yen, I discussed how institutional traders often raise capital. They borrow (or short) the low-yielding yen to invest in high-appreciating stocks and/or higher yielding income producers. When the yen rises in value, however, these same players may be forced to dump stocks in a hurry to avoid paying back loans on the appreciating currency. It follows that for the past 15 years, there has been a strong negative correlation between the S&P 500 and the yen. To add a layer of protection to your portfolio, you might consider hedging your long positions by owning CurrencyShares Japanese Yen (ARCA:FXY).


