🤓 Just 1 week into 2025: These 7 AI-picked stocks are up +9% eachUnlock Stocks

ETF Musings: XLF, XLI, XLF, SMH, IYR, IWM, HYG, EWZ, DDM

Published 11/14/2017, 12:16 AM
Updated 07/09/2023, 06:31 AM
DJI
-
US2000
-
EWZ
-
IYR
-
DDM
-
IWM
-
HYG
-
XLF
-
XLI
-
XLP
-
SMH
-

With the Dow exploding 0.07% today, it doesn’t exactly make for electrifying market discussion, so I thought I’d share a few thoughts about some select ETFs. These happened to load in reverse alphabetical order, so here we go……..

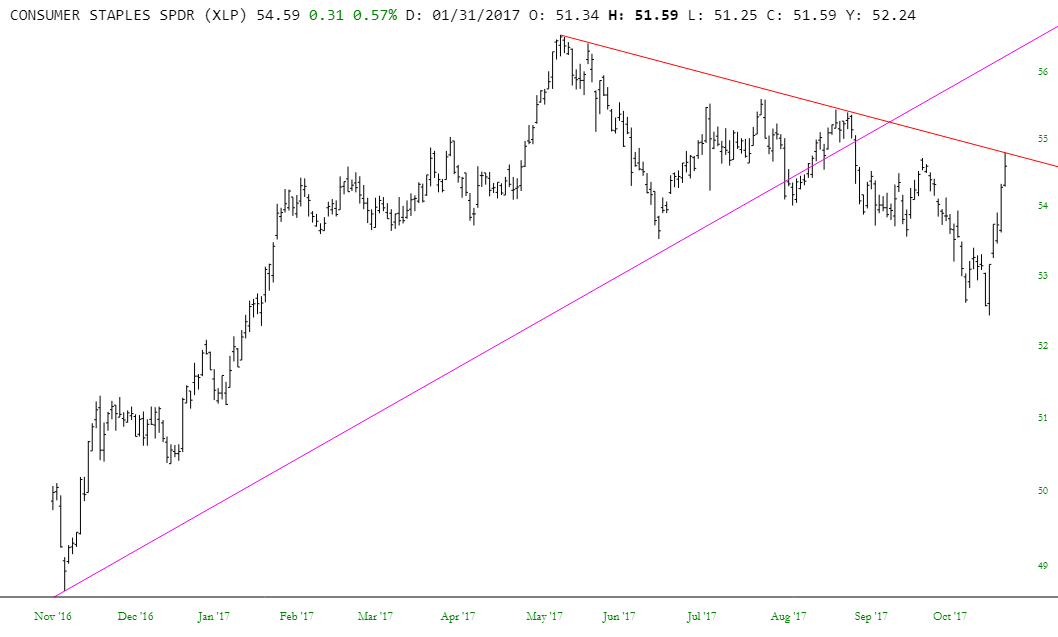
Consumer Staples (NYSE:XLP) has been a pretty big point of frustration for me. Over the past couple of weeks, it’s been terribly strong, managing to reach its intermediate-term descending trendline. Frankly it needs to weaken, and fast, in order to maintain its bearish configuration.
XLP Chart

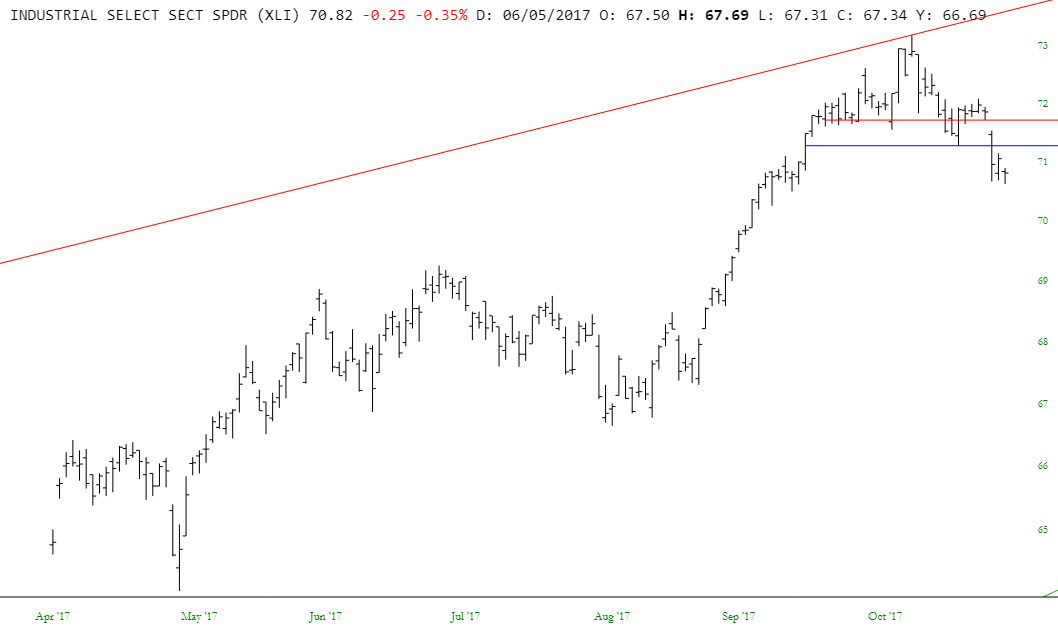
The Industrial Select (NYSE:XLI) sector is behaving itself much better. Even on a day like this, it continues to slip, and it’s got a spiffy little topping formation that’s complete.
XLI Chart

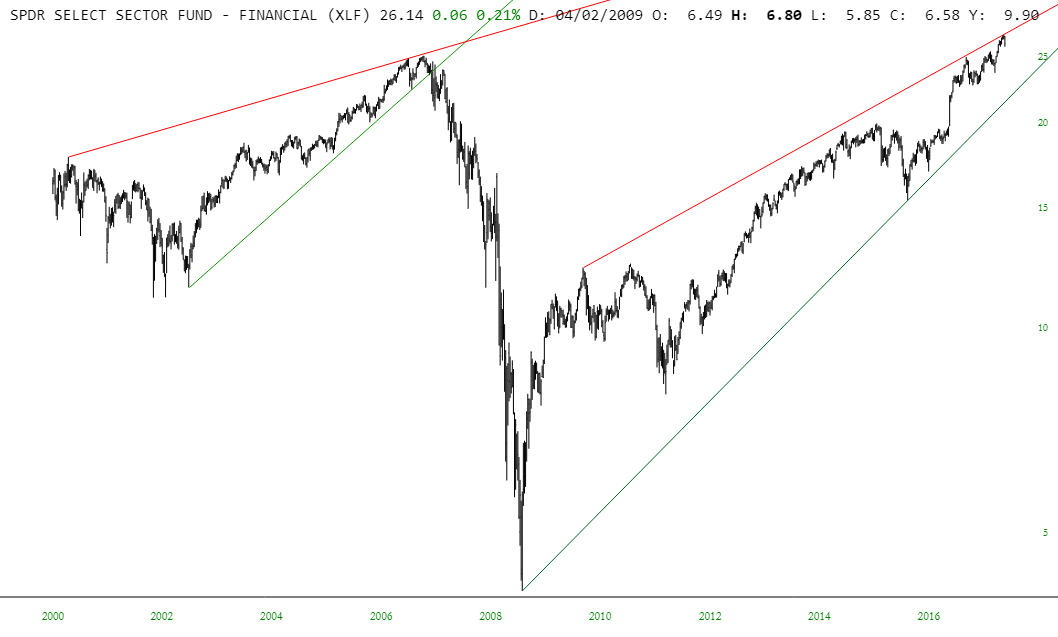
The Financials (NYSE:XLF) refuse to weaken, but its bull market is so terribly long in the tooth, I think its downturn is nearly inevitable. The powerful analog remains intact.
XLF Chart

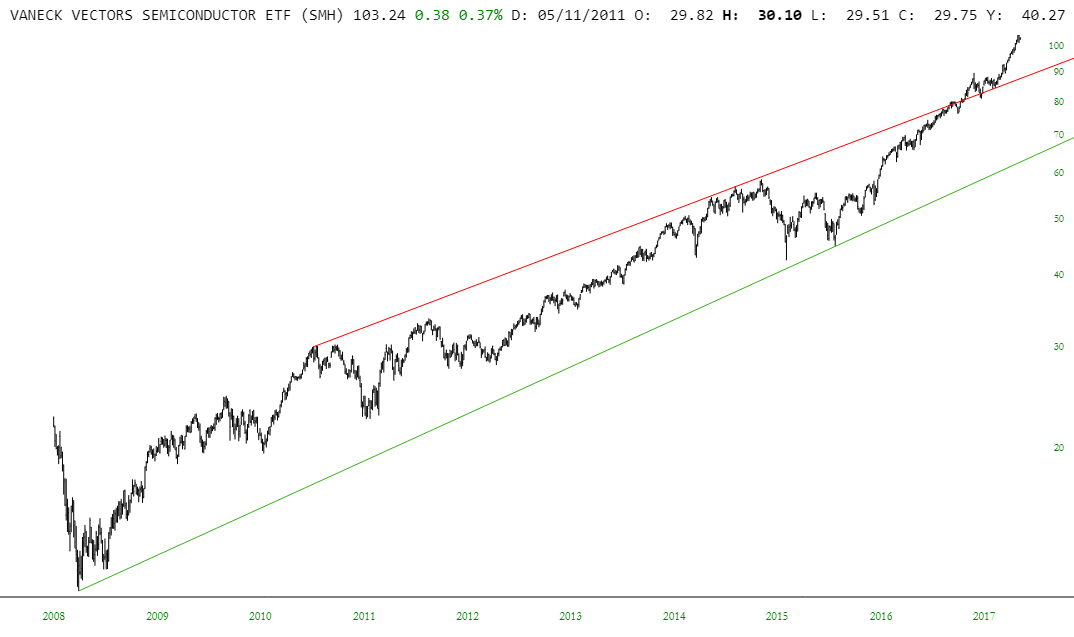
Semiconductors (NYSE:SMH) continue to be a monster, and I’m not going anywhere near them.
SMH Chart

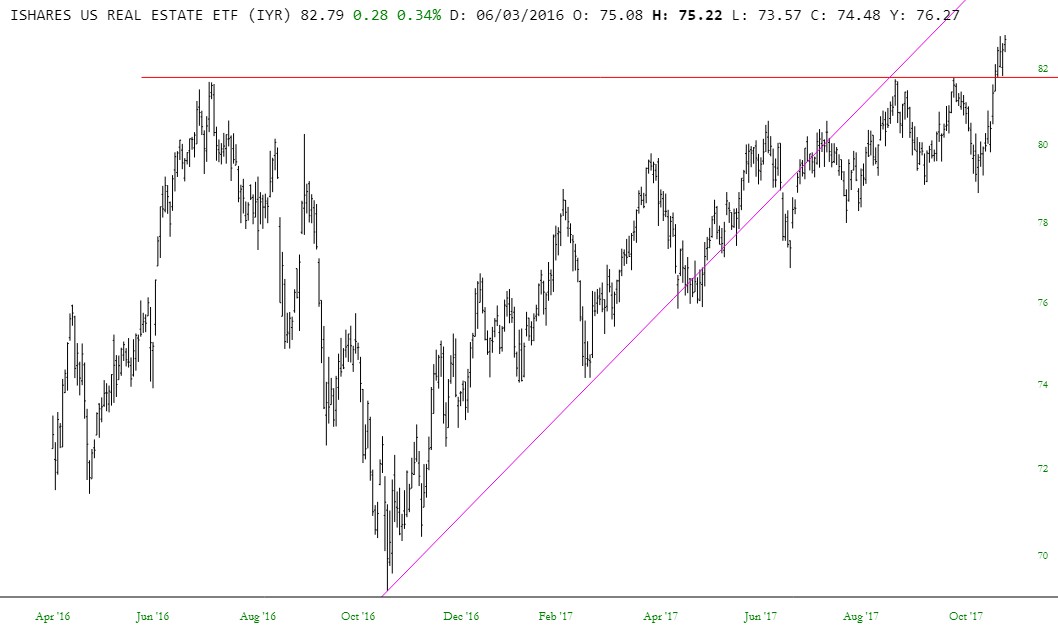
Real Estate (NYSE:IYR) remains surprisingly strong, and it’s pretty clear this bullish breakout has legs.
IYR Chart

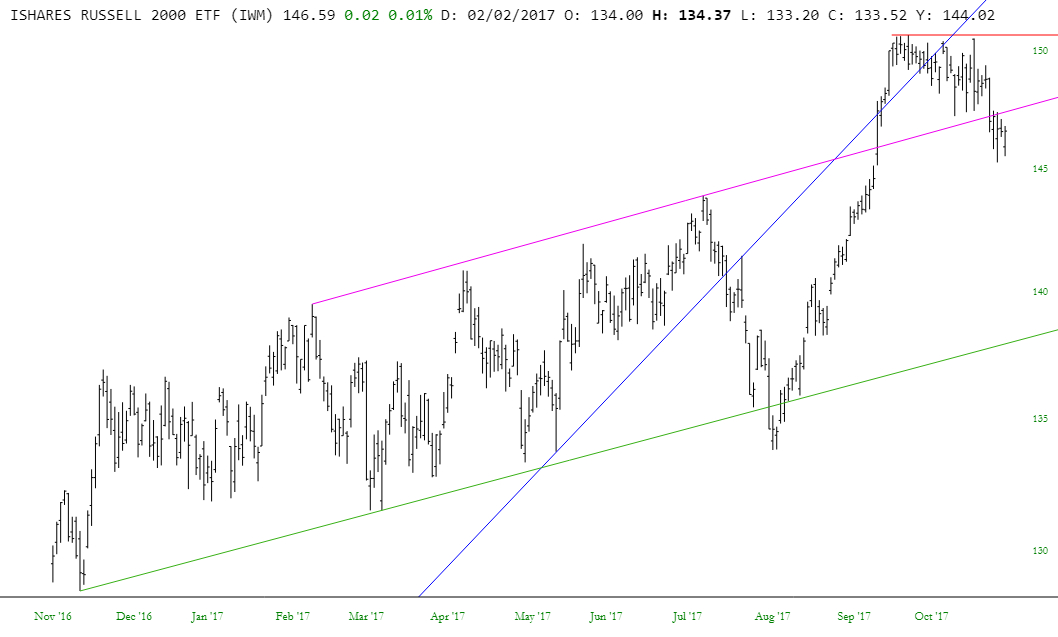
The Russell 2000 (NYSE:IWM) is breaking down quite nicely, in sharp contrast to more popular indexes.
IWM Chart

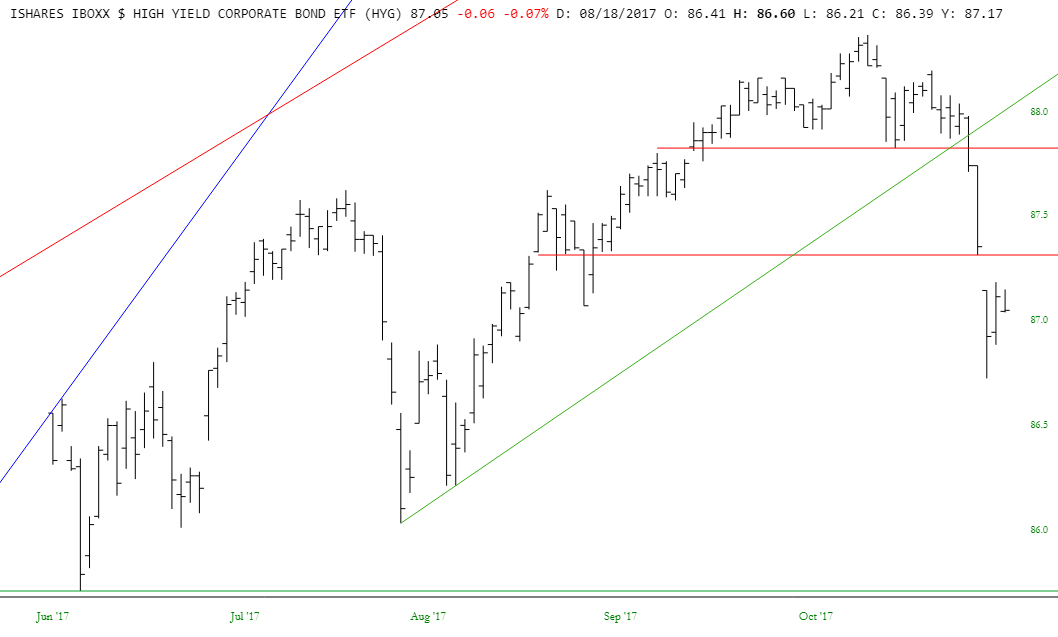
The mass media is finally starting to focus the same attention on High Yield Bonds (NYSE:HYG) that I’ve been giving it for months now. There is some serious weakening happening here.
HYG

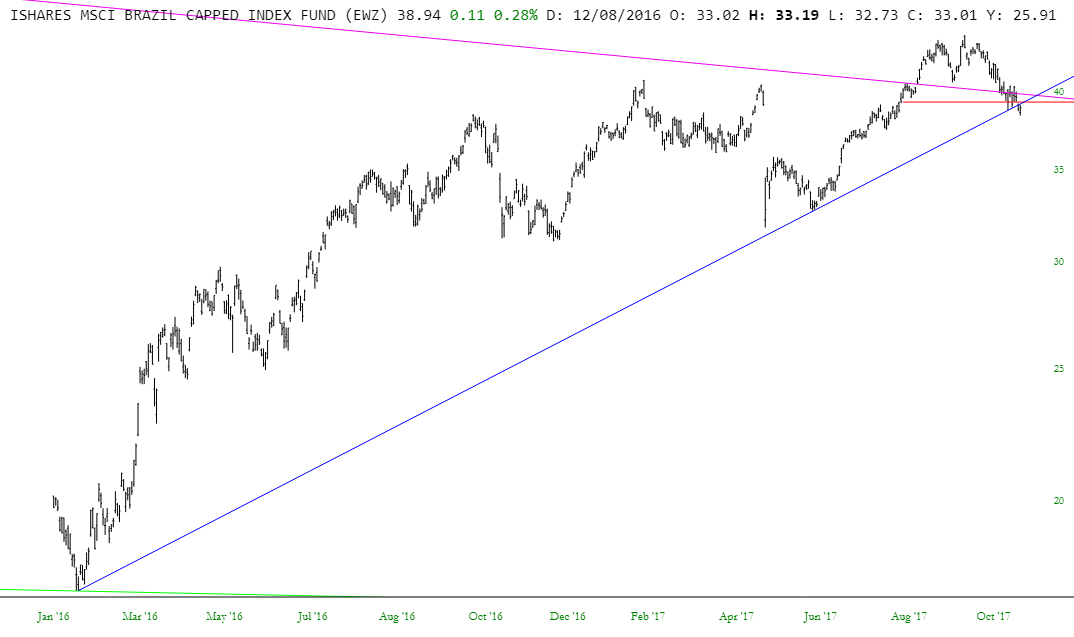
Brazil (NYSE:EWZ) had a bit of a bounce on Monday, but I think the damage is gone to that long-term trendline. This market is very vulnerable to continued weakness.
EWZ Chart

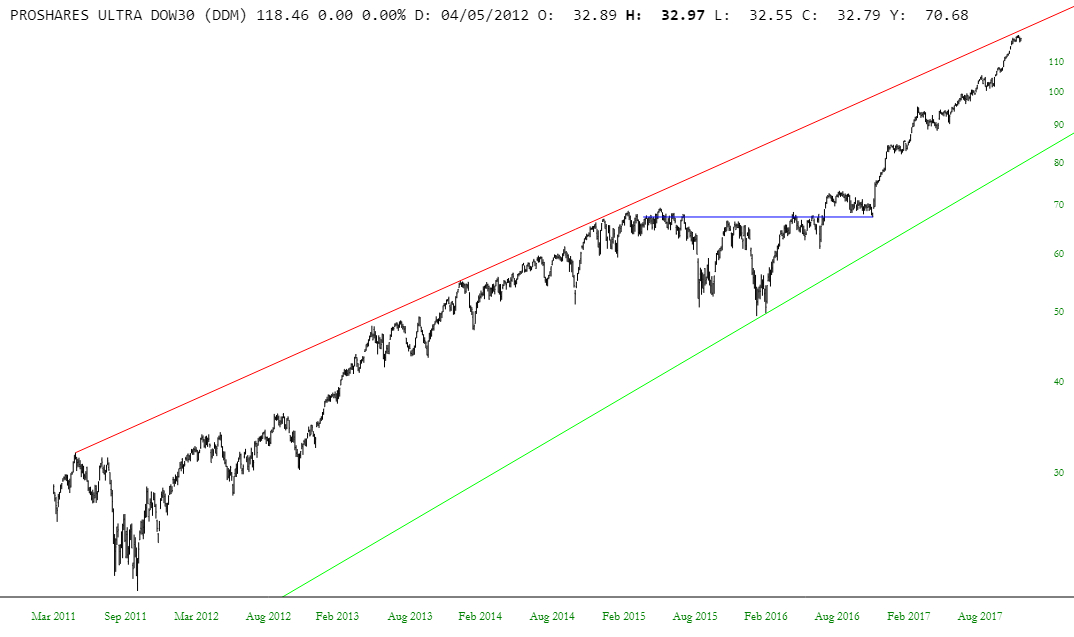
Lastly, the Ultra Dow (NYSE:DDM) – – which is the “double bullish” fund based on the Dow 30 – – quite plainly shows that prices remain much closer to long-term resistance (red line) than they do support (the green line, which is miles away).
DDM Chart

I’ll see you Tuesday morning.

Latest comments

Loading next article…
Risk Disclosure: Trading in financial instruments and/or cryptocurrencies involves high risks including the risk of losing some, or all, of your investment amount, and may not be suitable for all investors. Prices of cryptocurrencies are extremely volatile and may be affected by external factors such as financial, regulatory or political events. Trading on margin increases the financial risks.
Before deciding to trade in financial instrument or cryptocurrencies you should be fully informed of the risks and costs associated with trading the financial markets, carefully consider your investment objectives, level of experience, and risk appetite, and seek professional advice where needed.
Fusion Media would like to remind you that the data contained in this website is not necessarily real-time nor accurate. The data and prices on the website are not necessarily provided by any market or exchange, but may be provided by market makers, and so prices may not be accurate and may differ from the actual price at any given market, meaning prices are indicative and not appropriate for trading purposes. Fusion Media and any provider of the data contained in this website will not accept liability for any loss or damage as a result of your trading, or your reliance on the information contained within this website.
It is prohibited to use, store, reproduce, display, modify, transmit or distribute the data contained in this website without the explicit prior written permission of Fusion Media and/or the data provider. All intellectual property rights are reserved by the providers and/or the exchange providing the data contained in this website.
Fusion Media may be compensated by the advertisers that appear on the website, based on your interaction with the advertisements or advertisers.
© 2007-2025 - Fusion Media Limited. All Rights Reserved.