ES Triangle Scenario (Green) would be Super Bearish – Inverse H&S (Purple) Makes Another New High Likely
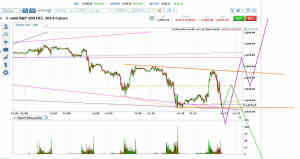
ES killed Part 3 of its Sornette bubble set-up after hours. That leaves a flat-bottomed triangle vs an inverse head and shoulders on the chart.
The flat-bottomed triangle (orange, with green scenario) would likely take the price through ES 2011 to at least 1937.50 with good odds of a crash straight to the October 15 low or a little beyond.
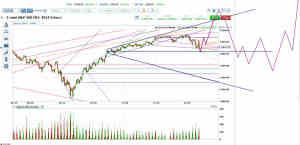
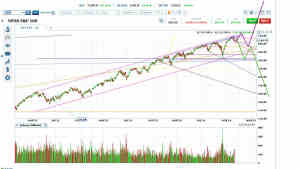
The inverse head and shoulders set-up (purple) would take the price to roughly ES 2011 and then probably another new all-time high before a correction to at least ES 1937.50. This inverse head and shoulders would also set up a longer-term bullish scenario, with a probable upwards breakout from the 3-year price channel on the S&P 500 and ES charts.
ES Inverse Head and Shoulders Scenario
Purple vs Green Scenarios on Long-Term Chart
In other words, excess bearishness in the very short term is probably bullish longer term, though ES will still be required to correct to 1937.50 before any bullish longer-term scenario can really get going.
A full drawn-out triangle (green scenario) would represent more disciplined selling and imply that the breakdowns in oil, SPDR Barclays High Yield Bond (ARCA:JNK), etc. are truly taking down everything.
As of 2:24 p.m. Pacific Time there’s been a good bounce off the bottom of the orange flat-bottomed triangle. It doesn’t take much of a wave up to make the orange triangle legal for a downward breakout.
ES 2010.50 remains the line in the sand.


