Investing.com’s stocks of the week
Market Brief
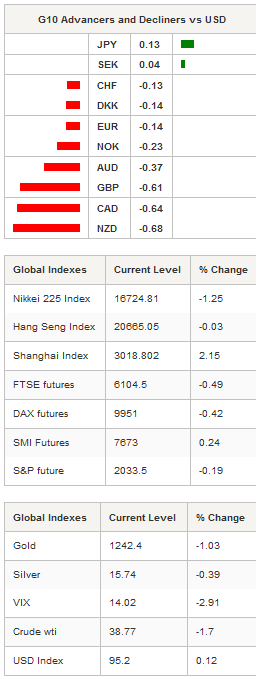
Commodity currencies continued to lose ground in Asia as crude oil prices test a key resistance area. The West Texas Intermediate failed to hold ground above the $40 level and even slid below $39, down 1.70% on the session. Similarly, the Brent crude fell 1.19% in Tokyo, down to $40.70 a barrel, unable to consolidate above the $42 level.
The New Zealand dollar fell the most in overnight trading as risk-on sentiment fades. However, the kiwi was able to consolidate the post-FOMC gains as it managed to hold above the $0.6750 level. On the downside, the next support can be found at 0.6576 (low from March 16th), while on the upside the high from March 18th will act as resistance.
Similarly, the Australian dollar found few buyers in Asia, with traders now wondering whether the recent rally is sustainable at such levels. Indeed, last Friday the Aussie reached its highest level against the greenback since July 1st 2015 at $0.7680, just a couple of days after the Fed surprised the market with its dovish tone. For now AUD/USD is consolidating at around 0.7580; further south a support can be found at 0.7415 (low from March 16th), while on the upside a resistance lies at $0.7680 (high from March 18th). Overall, we expect the commodity currency rally to pause for a while as traders reassess the market with a cool head.

Metals were also under selling pressure with gold falling 0.93%, silver 0.27%, platinum 0.94% and palladium 0.41%. In China, iron ore was better bid as the most liquid future contracts on the Dalian commodity exchange, rose 3.15% to 459 yuan/metric ton. Copper futures fell slightly, down 0.24%.
In the equity market, the rally in iron ore prices continued to boost Chinese equities. The Shanghai Composite and Shenzhen Composite were up 2.15% and 2.68% respectively. In Hong Kong, the Hang Seng was unchanged at 20,665 points. Elsewhere across Asia, equities were trading in negative territory with Australian shares down 0.32%, South Korean Kospi sliding 0.12% and Singapore shares off 1.04%. In Europe, futures are blinking red across the screen on the negative Asian lead.
Overall, we do not believe the market is done yet with the recent rally, but a period of consolidation was more than necessary, especially given the steady gains of the last few days. The USD was trading broadly higher but still below its pre-FOMC level.
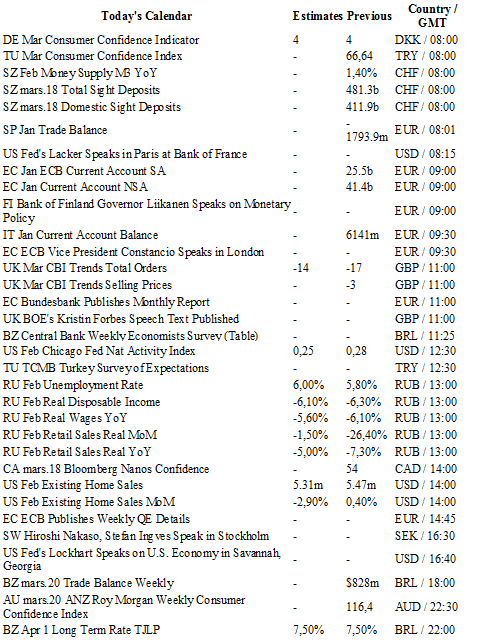
Today traders will be watching consumer confidence indicator from Denmark; sight deposits from Switzerland; Chicago Fed National Activity index, existing home sales and Fed’s Lacker speech from the US; unemployment rate and retail sales from Russia.

Currency Technicals
EUR/USD
R 2: 1.1495
R 1: 1.1376
CURRENT: 1.1245
S 1: 1.1058
S 2: 1.0810
GBP/USD
R 2: 1.4668
R 1: 1.4591
CURRENT: 1.4387
S 1: 1.4222
S 2: 1.4033
USD/JPY
R 2: 117.53
R 1: 114.91
CURRENT: 111.47
S 1: 107.61
S 2: 105.23
USD/CHF
R 2: 1.0257
R 1: 1.0093
CURRENT: 0.9722
S 1: 0.9651
S 2: 0.9476
