A September rate hike from the Federal Reserve seems to be the consensus among market participants. Fed member Dennis Lockhart’s overnight comments have clearly been taken as a step forward here.
Mr. Lockhart has been quite nuanced of late and is considered somewhat of a centrist, so the fact that he was fairly definitive in his view around a September hike has been taken as a shift in view. Perhaps the significance here is that we have seen a shift from a voting member in their monetary policy stance, but there also aren’t really any other Fed speakers scheduled for a while. It is now clear the Fed’s tolerance of low wages has increased and we’re not going to need to see a dramatic improvement in wage trends before raising the funds rate.
This makes the unemployment rate data print the most important aspect in this Friday’s payrolls, report in my opinion.
The reaction to Lockhart’s comments in the US two-year treasury was pronounced, with the yield pushing back for another play at the 75 basis-point ceiling. The market’s implied probability of a September hike has risen to 50% in Asian trade today, which is the first time the market has swung to having September as its base case. We know the sell-side economists have had September as their base case for a month or so, but we are now getting to a point of greater alignment between market pricing and the economists’ calls. The Fed will welcome this, as it greatly increases the probability that when they do hike, it shouldn’t be met with strong selling of treasuries and equities.
It’s worth bearing in mind that the market is currently pricing the fed fund rate to increase by 28 basis points over the coming three months, with rates expected to be lifted twice in a year and five times in two years. This seems conservative.
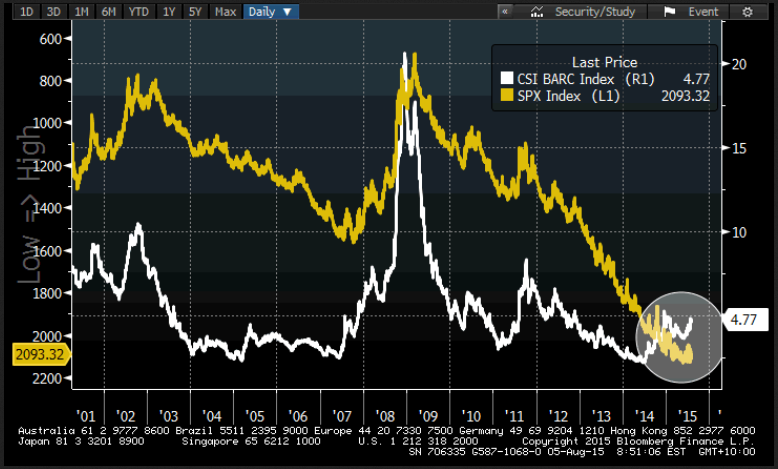
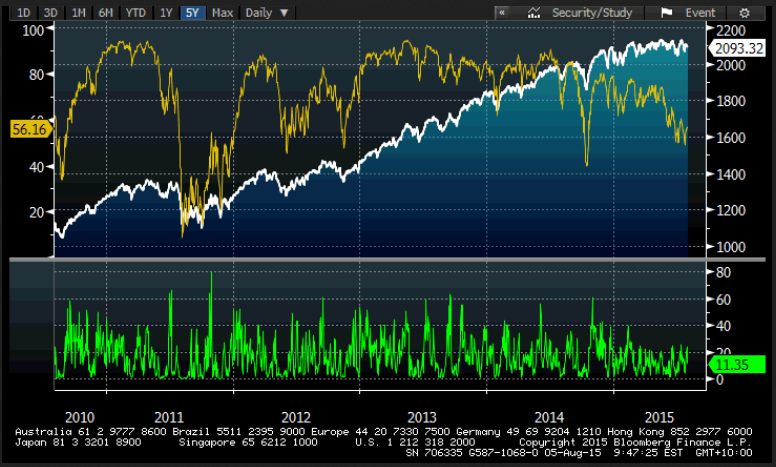
It’s interesting to note that there are a number of red flags in the US equity market that could drive global equities lower. We are not at the point of looking at bearish trades with more conviction just yet and, if you look at the S&P on a daily, weekly or monthly basis, the index is still consolidating. However, if you look at the falling market breadth, you can see that participation is falling away and leadership is far more concentrated. We have also seen spreads between high yield and investment-grade credit (corporate debt) relative to US treasuries widening aggressively of late, but the S&P just refuses to go along for the ride. Credit markets historically lead equities, so again this is a huge red flag for the bears. Will we see catch-up?
Bloomberg chart showing the S&P (yellow) vs the high yield/US treasury spread
S&P vs the % of stocks above their 200-day moving average (yellow). The lower chart shows the % of stocks making a new 4-week high


Still, while market breadth and credit markets give off a warning sign, I still think we need to see the technical picture for the S&P really deteriorate. My belief is we will need to see the index close the month below the 12-month moving average (currently at 2053). This average has defined some major trends over the last 20 years, so a monthly close, backed by falling participation and widening credit spreads could be the catalyst for a 10% correction – a fate that hasn’t occurred since April 2012. This will have huge ramifications for global markets.
Mr. Lockhart’s speech has resonated through Asia and we have seen traders looking favourably at AUD/USD shorts. It seems nothing has really changed and there is still enough fragility in the Australian economy to warrant fading AUD/USD moves above $0.7400. Did anyone really expect the RBA to act on its easing bias? Certainly the daily chart shows formidable downtrend resistance into $0.7450 and this seems to be respected.
Traders looking at playing a more hawkish or neutral RBA could look at AUD/NZD and I’d expect a wall of capital destined to buy the AUD on a break of the 2 July high of NZD1.1429. Certainly the move of late has been fully backed by the moves in the bond market, with the premium demanded by bond traders to lend to the New Zealand treasury over the Aussie treasury for two years contracting by about 80 basis points over the last few months.
In Asian equities, there has been some selling in the Chinese equity market today, but good buying has been seen in ASX stocks from the early morning dips. Mining names have been the place to be, although this has been assisted by a mix of short covering and some speculation around China purchasing a stake in FMG’s infrastructure. All eyes are on Rio Tinto (LONDON:RIO) for tomorrow’s half-year numbers.
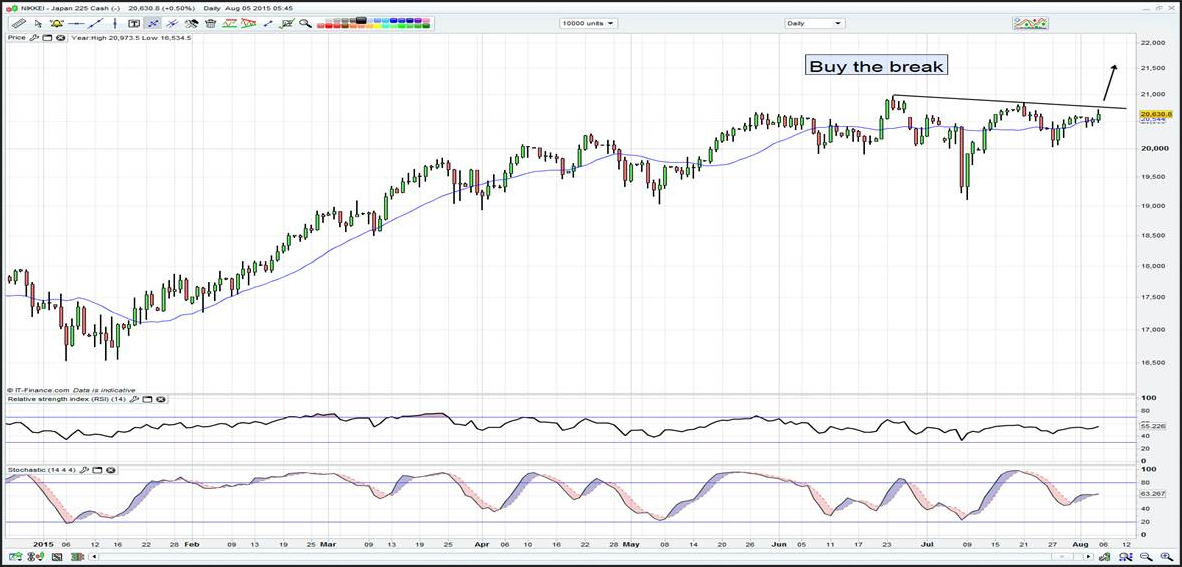
Japan has been the place to be and, while the Nikkei has been off the radar of late, it’s time to put it back on again. The Japanese earning season is giving traders a reason to own the market again. With around 65% of companies having reported, net income is beating consensus estimates by 13.7%, while revenue is beating estimates by 1.3%.

Compare this to the S&P 500, where earnings have beaten estimates by 4.4%. What’s more, 68% of companies have beaten on the EPS line, relative to 50% in the prior quarterly reporting season. The Japanese economy may be uninspiring, but the corporate landscape looks quite compelling, although buy-backs could be a little more aggressive. Watch for a move into the 24 June high in the short term.
