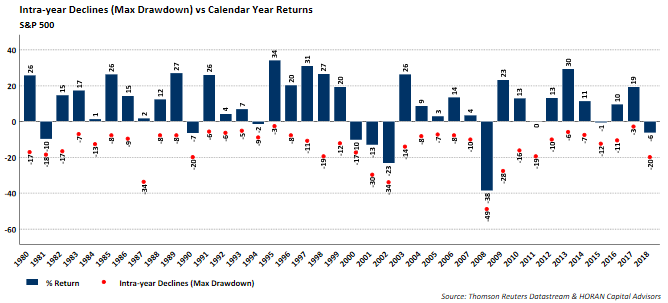
The Investment Company Institute releases fund flow and ETF net issuance data on Wednesday's with a one week lag. In Wednesday's report for the week ending March 13, 2019, ICI reports domestic equity inflows spiked to $12.8 billion. This represents the largest weekly inflow since March 20, 2018 when domestic equity inflows totaled $19.1 billion.
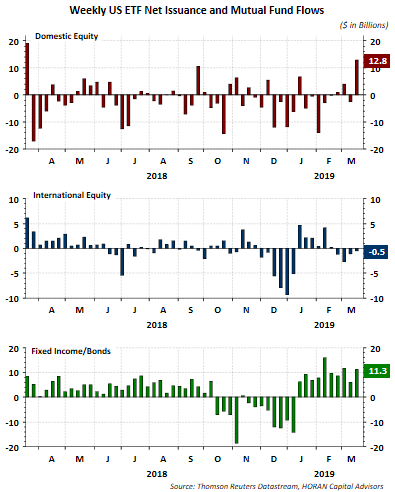
On a cumulative basis over the last one year period, domestic equity flows remain decidedly negative to the tune of minus $83.9 billion. Since mid February though, flows have been leaning towards inflows into domestic equity. The large cumulative outflow does represent potential funds on the sidelines that could still find its way into the equity market.
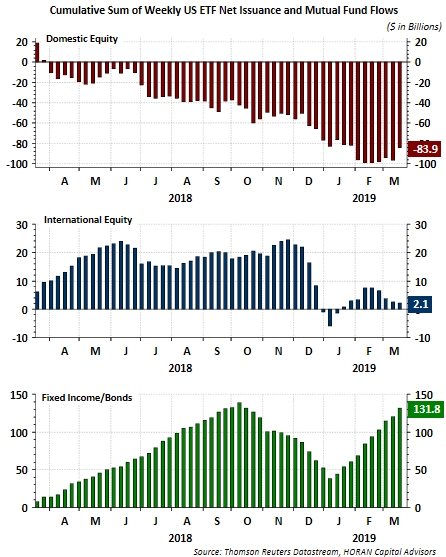
On a year to date basis the S&P 500 Index is up nearly 14% so some consolidation of the strong advance would not be a complete surprise. What would be equally unsurprising is the consolidation occurring from a higher level than where the market is today.
Also, slipping into some of the bearish commentary is the strength of the S&P 500 Index return when looking at those returns on a rolling 10-year annualized basis. As the below chart shows, as of the end of February the rolling 10-year annualized return for the S&P 500 is just above 15%. Clearly this return is approaching levels experienced at prior market peaks as seen below.
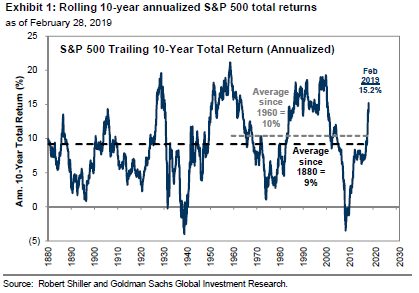
In looking at a 15-year rolling annualized period though, and one that might be more as realistic for a long term investor, the return is half the 10-year annualized results shown above. Using monthly Shiller data through March 2019, the 15-year annualized return equals 8.27%. This return is further below both the market peak reached near the top of the technology bubble and the top reached in the mid 1960's.
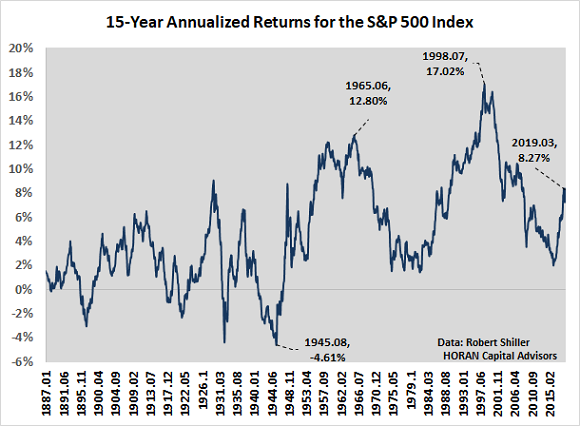
The selected time period matters when evaluating returns with the 15-year annualized results being further below prior market peaks than the 10-year annualized return chart. Worth keeping in mind is the fact the market can generate strong returns consistently over multiple yearly periods as it did in the mid 1990's where the index returns were greater than 20% over one five year stretch. At the end of the day, the market's return in and of itself, and the same applies to individual companies, is not the sole driver of the future return potential for equities.
