Imagine you’re a pilot who is preparing to land an airplane. You’ve just eased up on the throttle, thereby slowing your airspeed. To compensate, you gently pull back on the yoke to increase the plane’s angle of attack. A buzzer suddenly goes off… it’s the stall warning. Your approach is too slow! The aircraft is at risk of rapidly losing altitude and the consequences could be dire.
The concept of a stall speed can apply to economics, as well. That is, economic output tends to transition to a slow-growth phase (stall) at the end of an expansion before the economy falls into a recession.
Right now, a buzzer should be sounding at the Federal Reserve because the U.S. economy has officially slowed below stall speed.
Excluding the impact of inventories, real economic growth in the first half of 2015 was just 0.54%. Lackluster wage growth also indicates continued labor market slack. In the second quarter, the Employment Cost Index, a broad measure of labor costs, posted the smallest gain since records began in 1982.
Indeed, recent data further support my view that the risk of a meaningful rise in interest rates is low. And because we’re in a subdued economic growth and inflation environment, I believe that the utilities – electricity, gas, and water companies – continue to be viable investments.
However, we must be wary of valuations, especially for relatively high-yielding securities. Investors starved for yield have bid up prices across the utility sector, pushing average valuations to historically high levels. We also want to avoid utilities that are excessively levered.
Luckily, we can help alleviate both of these concerns with the trusty enterprise value-to-EBITDA (EV/EBITDA) ratio.
Remember, the EV/EBITDA ratio compares the total stakeholder value net of cash with the total cash flows available to all stakeholders. Firms with high equity valuations and/or high debt levels have higher (less attractive) EV/EBITDA ratios.
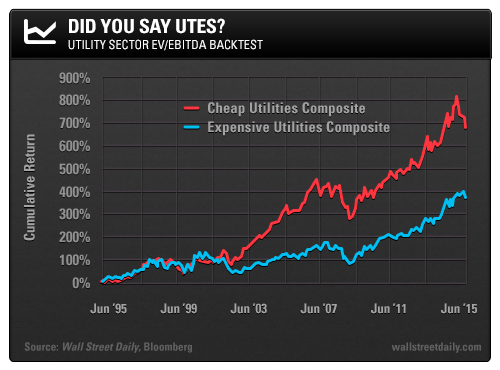
To illustrate the power of this valuation metric, I ran a backtest starting in June 1995. Here, my universe of stocks is US-listed utilities with market caps above $1 billion. The stocks are ranked based on EV/EBITDA, and the top two deciles (cheapest 20%) are included in the Cheap Utilities Composite. The bottom two deciles (most expensive 20%) are included in the Expensive Utilities Composite.
The screen is rerun each month and the composites change as the companies’ valuations change. The constituents are allocated to on an equal-weight basis and the cumulative total return (dividends reinvested) for each composite is tallied.
The results of this backtest are shown below:

As you can see, the Expensive Utilities Composite produces a cumulative return of 363% over 20 years. Meanwhile, the Cheap Utilities Composite gained an incredible 680%, which actually trounces the 451% total return posted by the mighty S&P 500 over this same time frame.
Clearly, there’s an edge to buying cheap utilities based on the EV/EBITDA ratio. Furthermore, the cheap utilities also experienced smaller declines. The largest drawdown (peak to trough decline) that you would’ve experienced in the Expensive Utilities Composite was 40%, compared with just 35% for the Cheap Utilities Composite.
Higher returns with lower volatility – the best of both worlds.
Currently, the median EV/EBITDA for all U.S.-listed utilities with market caps greater than $1 billion is 9.9, which is relatively high. The current constituents of the Cheap Utilities Composite, which includes companies such as AES (NYSE:AES), Ameren (NYSE:AEE), AGL Resources (NYSE:GAS), and Pinnacle West (NYSE:PNW), have a median EV/EBITDA of 7.8.
In the midst of persistently low interest rates and with an economy below stall speed, utilities are attractive investments that can help protect your portfolio from broader stock market declines. Just make sure your utilities are cheap with a low degree of leverage.
