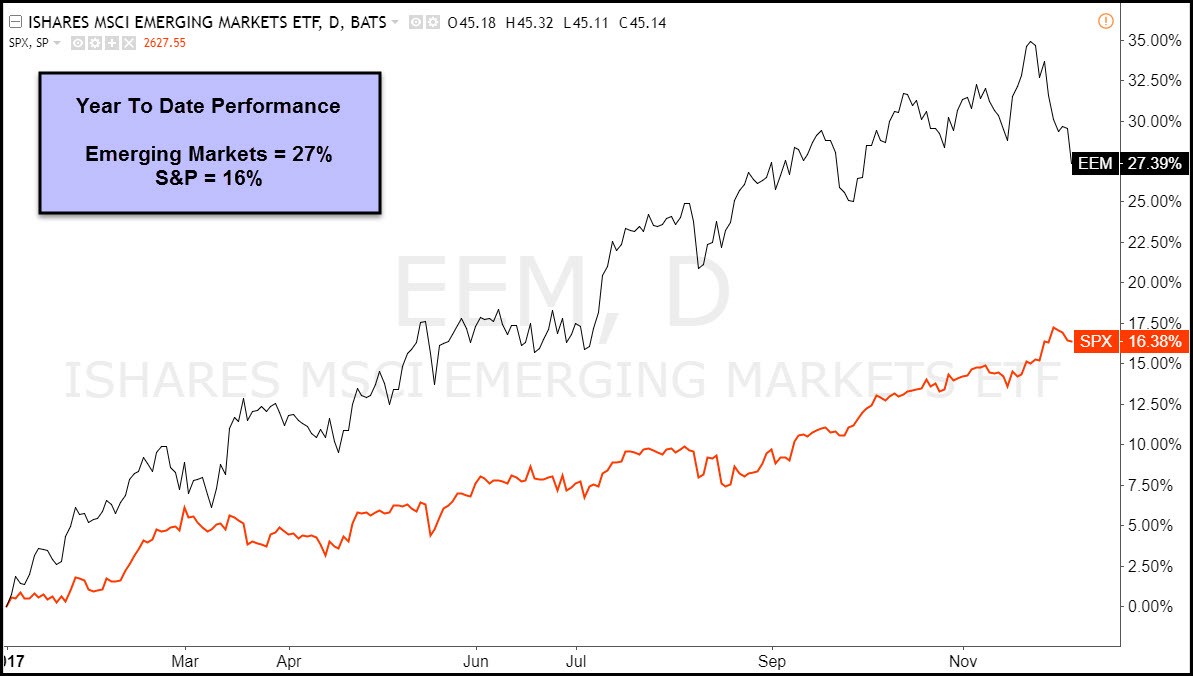
Year to date, Emerging markets (NYSE:EEM) have lived up to their name, as they have emerged to gain much more than the S&P 500. Recently, EEM was up nearly twice that of the S&P 500 this year. (See YTD performance below).

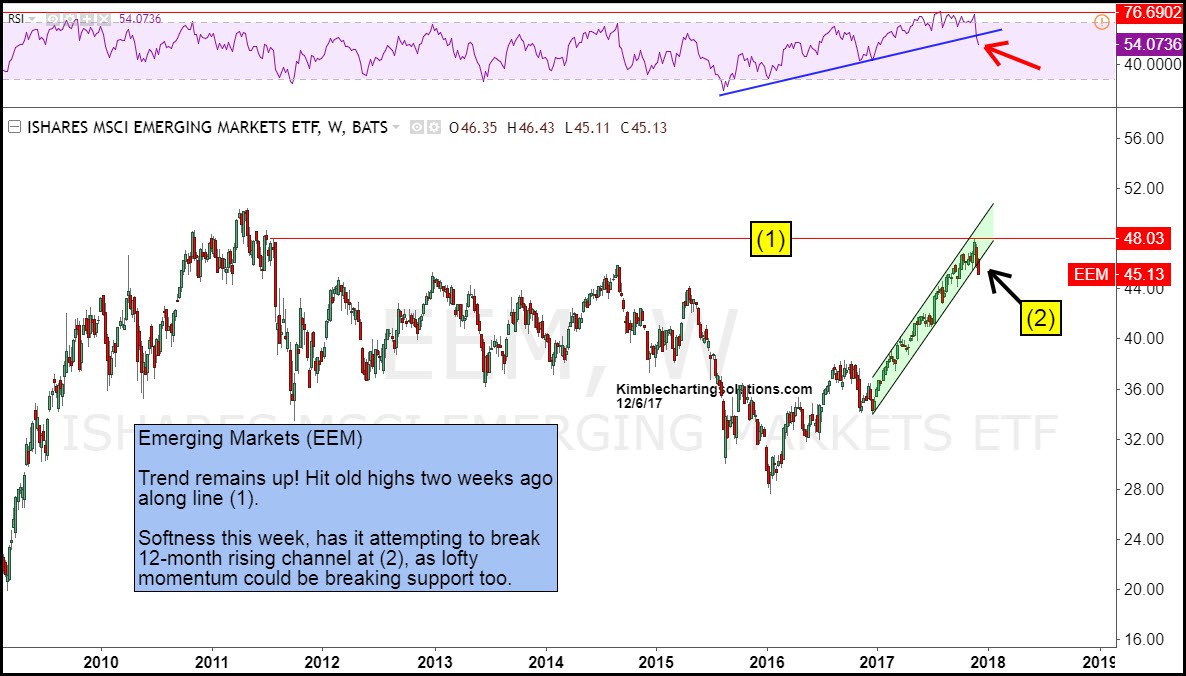
The chart below looks at EEM over the past 8 years and shows how an important test could be taking place.

The weekly chart highlights that EEM's trend over the past 2 years is up. It also shows that the trend over the past 6 years is flat, as EEM is no higher of late than it was in 2011.
EEM's strong 12-month rally saw it hit 2011 lower-highs along line (1) 3 weeks ago as momentum was hitting the highest levels since the 2007 highs. The softness over the past couple of weeks has EEM attempting to break rising support at (2), while momentum is trying to the do the same.
EEM has been in a leadership role the past 2 years. What it does at (2) could send an important message about emerging and global markets around the world.
About To Submerge?
Two weeks of soft action does NOT prove a trend change has taken place. Further weakness at (2) could bring on more selling, so keep a close eye on what EEM does over the next couple of weeks.
