After a troublesome August and most of September, risk appetites were rekindled beginning in late September. It has been aided by ideas that the period of extremely accommodative monetary policy by the major central banks will persist longer than previously anticipated. This has weighed on the dollar, lifting equities and commodities.
The volatility that had emanated from China has also subsided. With today's move, the dollar has eased 2% against the yuan since peaking two months ago. The Shanghai Composite's 3.3% gain today brings its advance to 8% since the market re-opened from the national holidays last Thursday.
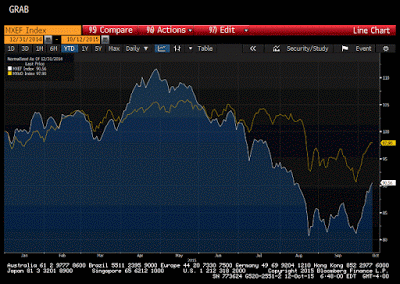
The outperformance this year of the developed equity markets over the emerging market equities has been more a function of weakness in the latter than strength in the former. This is illustrated in this Great Graphic from Bloomberg. The yellow line is the MSCI World Index (DM) and the white line is the iShares MSCI Emerging Markets (EM) equity index.

However, while the emerging market equity measure held the August 24 low, the developed equities made a new low in late-September. Since then, emerging market equities have outperformed the developed equities. The MSCI Emerging Market equity index is closing in on a 38.2% retracement of the slide since late-April. It is currently trading about 1.5% below the objective.
The MSCI World Index (DM) peaked in late-May. It pushed through the 38.2% retracement in the middle of last week and went on to test the 50% retracement before the weekend. It is little changed today.

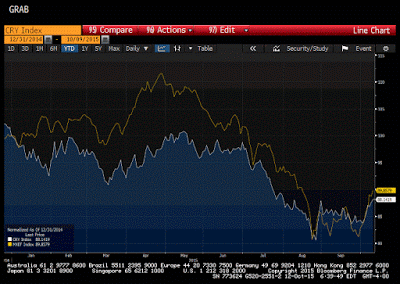
The second Great Graphic here illustrates another consideration. It shows the MSCI Emerging Market equity index (yellow line) and the CRB index (white line). Both time series were indexed to the end of last year.
Emerging market equities broadly tracked the fall in commodities, but fared better until the middle of Q2. By the end of August, both indices were off nearly 20% for the year. At the end of September, the equities were experiencing slightly larger year-to-date declines than the CRB index. However, the rally this month has put emerging market equities back ahead of the CRB index.
Corrective forces may have more room to play in the near-term. However, the global growth dynamics have not changed. We also note that while the CRB index has advanced, the JOC-ECRI Industrial Price Index made fresh six-year lows before the weekend.
