🐂 Not all bull runs are created equal. November’s AI picks include 5 stocks up +20% eachUnlock Stocks

Elliott Wave Analysis: S&P 500 Should See More Weakness

Published 03/23/2018, 12:59 AM
Updated 03/09/2019, 08:30 AM
US500
-

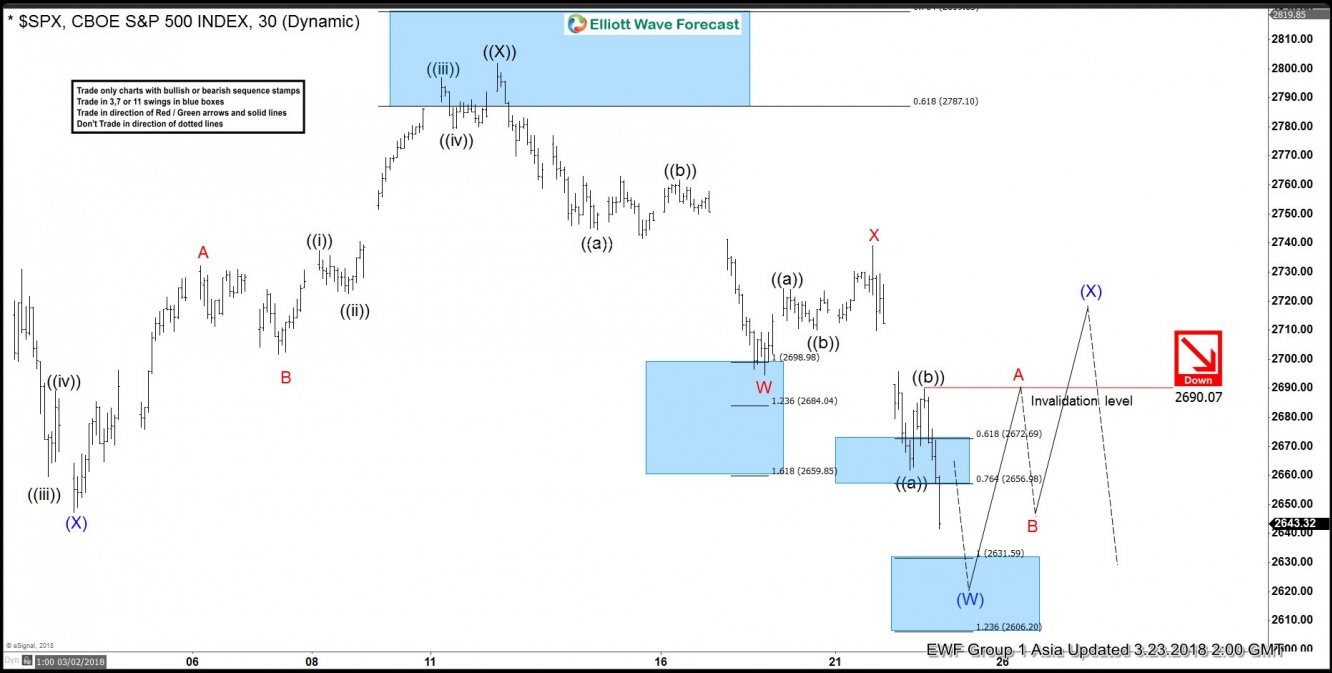
S&P 500 rally to 2801.9 on 3.13.2018 ended Primary wave ((X)). Since then, the decline from there is unfolding as a double three Elliott Wave structure where Minor wave W ended at 2694.59 and Minor wave X ended at 2739.14. A double three is a WXY structure where the subdivision of each leg is corrective. Subdivision of Minor wave W unfolded as a zigzag Elliott Wave structure where Minute wave ((a)) ended at 2744.38, Minute wave ((b)) ended at 2761.85, and Minute wave ((c)) of W ended at 2694.59. Subdivision of Minor wave X unfolded as another zigzag where Minute wave ((a)) ended at 2724.22, Minute wave ((b)) ended at 2710.05, and Minute wave ((c)) of X ended at 2739.14.

Minor wave Y is currently in progress as a zigzag Elliott Wave structure where Minute wave ((a)) ended at 2661.78 and Minute wave ((b)) ended at 2690.07. Near term focus is on 2606.2 – 2631.59 area to complete Minute wave ((c)) of Y. The next move lower also should complete Intermediate wave (W) of higher degree and end cycle from 3.13.2018 high. Index should then bounce in Intermediate wave (X) to correct cycle from 3.13.2018 high in 3, 7, or 11 swing before the decline resumes.

S&P 500 1 Hour Elliott Wave Chart
SPX 23 March


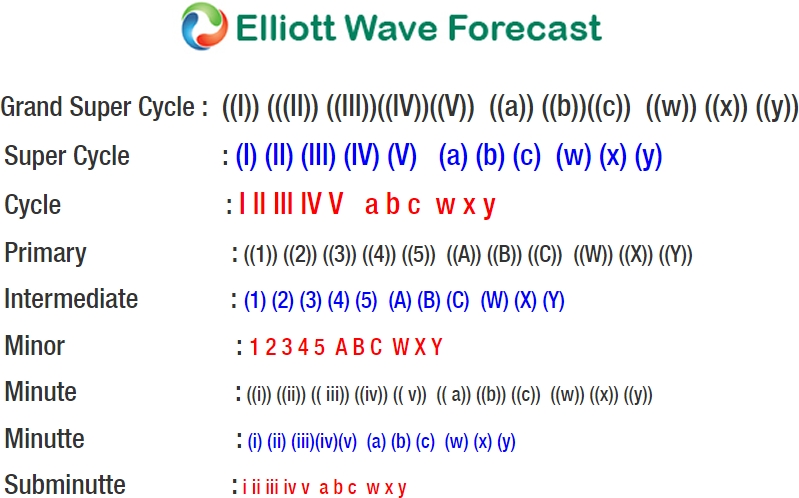
ew cycle

Latest comments

Loading next article…
Risk Disclosure: Trading in financial instruments and/or cryptocurrencies involves high risks including the risk of losing some, or all, of your investment amount, and may not be suitable for all investors. Prices of cryptocurrencies are extremely volatile and may be affected by external factors such as financial, regulatory or political events. Trading on margin increases the financial risks.
Before deciding to trade in financial instrument or cryptocurrencies you should be fully informed of the risks and costs associated with trading the financial markets, carefully consider your investment objectives, level of experience, and risk appetite, and seek professional advice where needed.
Fusion Media would like to remind you that the data contained in this website is not necessarily real-time nor accurate. The data and prices on the website are not necessarily provided by any market or exchange, but may be provided by market makers, and so prices may not be accurate and may differ from the actual price at any given market, meaning prices are indicative and not appropriate for trading purposes. Fusion Media and any provider of the data contained in this website will not accept liability for any loss or damage as a result of your trading, or your reliance on the information contained within this website.
It is prohibited to use, store, reproduce, display, modify, transmit or distribute the data contained in this website without the explicit prior written permission of Fusion Media and/or the data provider. All intellectual property rights are reserved by the providers and/or the exchange providing the data contained in this website.
Fusion Media may be compensated by the advertisers that appear on the website, based on your interaction with the advertisements or advertisers.
© 2007-2024 - Fusion Media Limited. All Rights Reserved.