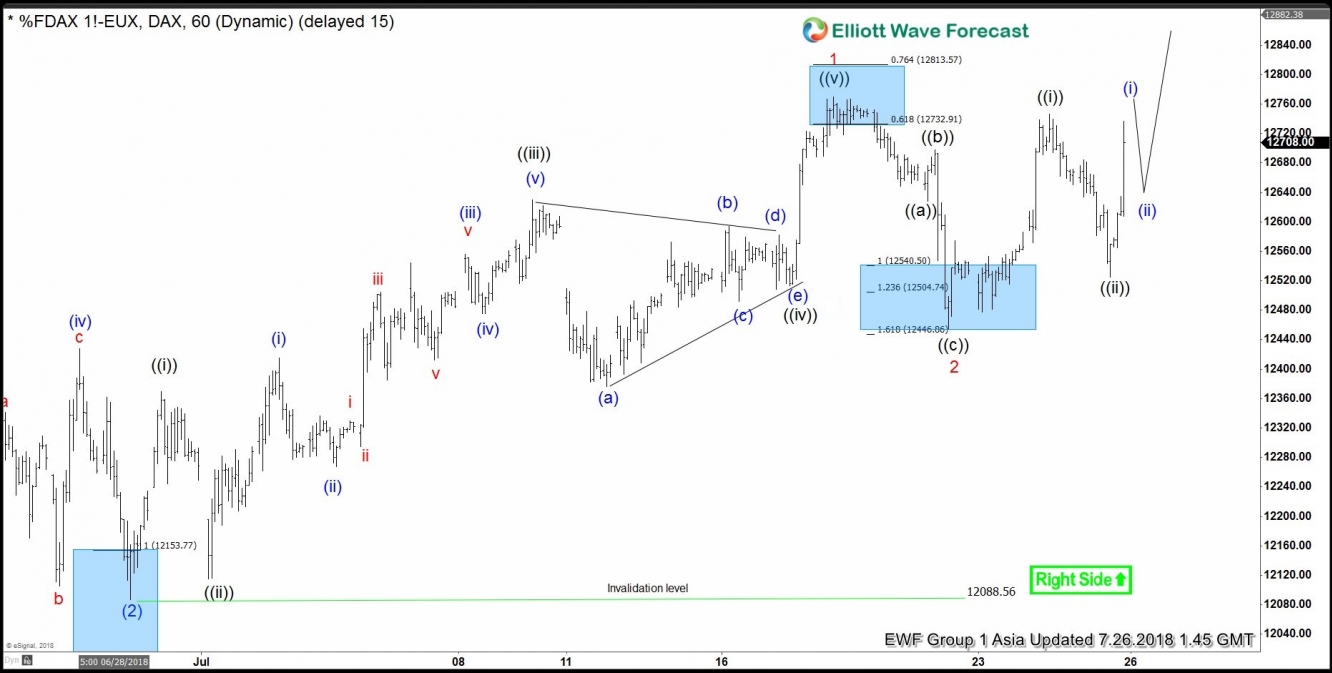
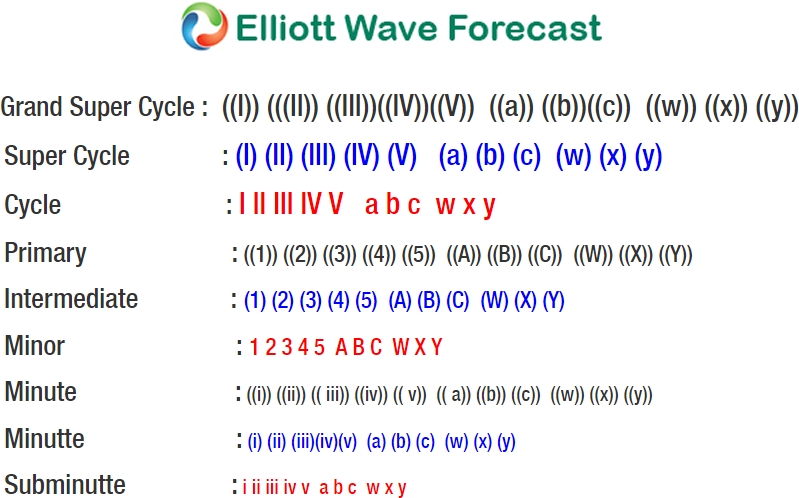
DAX short-term Elliott wave analysis suggests that the pullback to 6.28.2018 low ended intermediate wave (2) at 12088.56. Up from there, the rally higher to 12769.8 higher ended Minor wave 1. The internals of that rally higher took place as impulse structure with internal sub-division of 5 wave structure in Minute wave ((i)), ((iii)) & ((v)). On the other hand, Minute wave ((ii)) & ((iv)) took place in 3 waves corrective structure.
Above from 6.28 low cycle, the rally higher to 12369.5 high ended Minute wave ((i)). Down from there, the pullback to 12115 low ended Minute wave ((ii)). The rally higher from there took place in 5 waves structure and ended the Minute wave ((iii)) at 12630 high. Below from there, the pullback to 12513.5 ended Minute wave ((iv)) as a contracting triangle. The final rally higher from there ended Minute wave ((v)) of 1 at 12769.5 peak. Down from there, the correction against 6.28.2018 low cycle completed Minor wave 2 at 12454.5 low after reaching the blue box area at 12540.50-12446.86 100%-161.8% Fibonacci extension area. Near-term, while dips remain above 12454.5 low and more importantly above 12088.56 low, expect the Index to resume the upside in Minor wave 3 higher. We don’t like selling it.
DAX 1 Hour Elliott Wave Chart


