- All Instrument Types
- Indices
- Equities
- ETFs
- Funds
- Commodities
- Currencies
- Crypto
- Bonds
- Certificates
Please try another search

Elliott Wave Analysis: Triangle On S&P 500 Pointing Higher

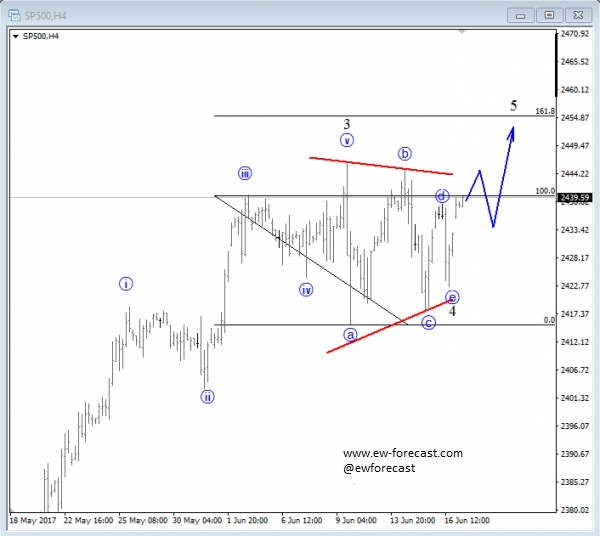
Updated chart on S&P 500 is showing a triangle formation in wave 4 that is pointing to higher prices now. We are looking at wave 5 that can already be underway up to 2455-2460 this week, while market is above 2415.
S&P500, 4H

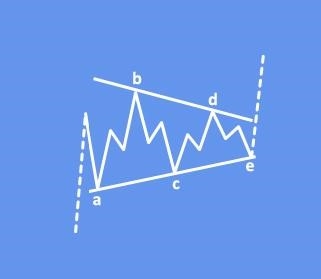
A Triangle is a common 5-wave pattern labeled A-B-C-D-E that moves counter-trend and is corrective in nature. Triangles move within two channel lines drawn from waves A to C, and from waves B to D. A Triangle is either contracting or expanding depending on whether the channel lines are converging or expanding. Triangles are overlapping five wave affairs that subdivide 3-3-3-3-3.
Triangles can occur in wave 4, wave B, wave X position or in some very rare cases also in wave Y of a combination
Triangle Pattern:

Disclosure: Please be informed that information we provide is NOT a trading recommendation or investment advice. All our work is for educational purposes only.
Related Articles

Shares of Caesars Entertainment (NASDAQ:CZR), a leading gambling stock, traded around 3% higher on Wednesday morning, though the stock was trading around 1.5% lower shortly before...

Amazon (NASDAQ:AMZN) is making a significant push into the future with a robust investment in robotics and artificial intelligence. The company has earmarked $35 billion for...

Home Depot’s (NYSE:HD) Q4 2024 report and guidance for 2025 have plenty to be unhappy about, but the simple truth is that this company turned a corner in 2024. It is on track for...
Are you sure you want to block %USER_NAME%?
By doing so, you and %USER_NAME% will not be able to see any of each other's Investing.com's posts.
%USER_NAME% was successfully added to your Block List
Since you’ve just unblocked this person, you must wait 48 hours before renewing the block.
I feel that this comment is:
Thank You!
Your report has been sent to our moderators for review


Add a Comment
We encourage you to use comments to engage with other users, share your perspective and ask questions of authors and each other. However, in order to maintain the high level of discourse we’ve all come to value and expect, please keep the following criteria in mind:
Enrich the conversation, don’t trash it.
Stay focused and on track. Only post material that’s relevant to the topic being discussed.
Be respectful. Even negative opinions can be framed positively and diplomatically. Avoid profanity, slander or personal attacks directed at an author or another user. Racism, sexism and other forms of discrimination will not be tolerated.
Perpetrators of spam or abuse will be deleted from the site and prohibited from future registration at Investing.com’s discretion.