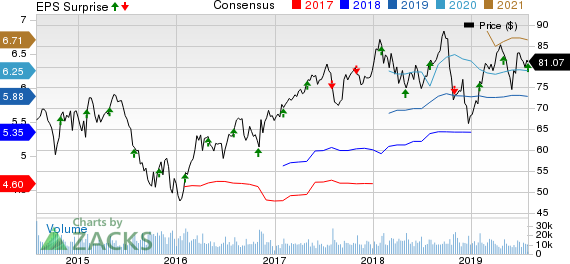
Eaton Corporation, PLC Price, Consensus and EPS Surprise

Eaton Corporation, PLC price-consensus-eps-surprise-chart | Eaton Corporation, PLC Quote
Segment Details
Electrical Products’ total second-quarter sales were $1,849 million, up 2.4% from the year-ago level. Although organic sales were up 4% from the prior-year quarter, the metric was negatively impacted by 2% due to currency translation. Operating income was $361 million, up 8.1% year over year.
Electrical Systems and Services’ total sales were $1,582 million, up 4.6% from the year-ago quarter. While organic sales were up 5% from the year-ago quarter, the metric was negatively impacted by 1% due to currency translation. Notably, the acquisition of Ulusoy added 1% to sales. Operating income in the quarter was $275 million, up 21.1% year over year.
Hydraulics total sales were $698 million, down 3.5% from the year-ago quarter. Organic sales, flat year over year, were negatively impacted by 3% due to currency translation. Operating income in the quarter was $80 million, down 20.8% year over year.
Aerospace total sales were $517 million, up 11.7% from the year-ago quarter due to 13% organic sales growth. Additionally, operating income in the quarter was $127 million, up 41.1% year over year.
Vehicle total sales were $803 million, down 10.7% from the year-ago quarter, owing to a 9% decline in organic sales and 2% negative currency translation. Moreover, operating income in the quarter was $136 million, down 18.1% year over year.
eMobility segment’s total sales were $84 million, up 1.2% from the year-ago quarter. Organic sales, up 2% from the prior-year level, were negatively impacted by 1% due to currency translation. Operating income in the quarter was $7 million, down 50% year over year, primarily due to higher spending on research and development activities.
Quarterly Highlights
Segment margins in the reported quarter were 17.9%, up 90 basis points (bps) from the year-ago level.
Cost of products sold in the reported quarter was $3,697 million, up 0.7% from the year-ago figure.
Selling and administrative expenses were $907 million, up 0.7% from the year-ago quarter.
The company’s research and development expenses in the second quarter were $151 million, up 4.1% from the prior-year period. Interest expenses of $63 million were down 7.3% from the prior-year quarter.
Orders in Electrical Products, Electrical Systems and Services, and Aerospace were up 1%, 3% and 15% year over year, respectively. On the contrary, Hydraulics’ orders were down 8% year over year due to weakness in the global mobile equipment market.
The company repurchased shares worth $260 million year to date.
Financial Update
Eaton’s cash & cash equivalents were $412 million as of Jun 30, 2019 compared with $283 million on Dec 31, 2018.
As of Jun 30, 2019, long-term debt of the company was $8,079 million, up marginally from $6,768 million on Dec 31, 2018.
Guidance
Third-quarter 2019 earnings per share are expected between $1.50 and $1.60.
The company now expects 2019 earnings within $5.77-$5.97, up from the prior guided range of $5.72-$6.02 per share. Segment operating margin in 2019 is expected within 17.1-17.5%.
Eaton has plans to repurchase shares worth $600 million in 2019.
The company expects organic revenues to improve 3% in 2019, down 100 bps from the prior expectation.
Zacks Rank
Currently, Eaton has a Zacks Rank #3 (Hold). You can see the complete list of today’s Zacks #1 Rank (Strong Buy) stocks here.
Upcoming Releases
Emerson Electric Co. (NYSE:) is slated to announce third-quarter fiscal 2019 earnings on Aug 6. The Zacks Consensus Estimate for the quarter is pegged at 94 cents.
Regal Beloit Corporation (NYSE:) is slated to announce second-quarter 2019 earnings on Aug 5. The Zacks Consensus Estimate for the quarter to be reported is pegged at $1.63.
Enersys (NYSE:) is scheduled to report fiscal first-quarter 2020 earnings on Aug 8. The Zacks Consensus Estimate for the to-be-reported quarter is pegged at $1.32.
Today's Best Stocks from Zacks
Would you like to see the updated picks from our best market-beating strategies? From 2017 through 2018, while the gained +15.8%, five of our screens returned +38.0%, +61.3%, +61.6%, +68.1%, and +98.3%.
This outperformance has not just been a recent phenomenon. From 2000 – 2018, while the S&P averaged +4.8% per year, our top strategies averaged up to +56.2% per year.
See their latest picks free >>

