It is spring and in Ohio that means it is time to plant corn and soybeans. Farmers have already determined their mix and and are obtaining their seed. The big farm equipment has been inspected and is ready for plowing and planting. In 2 months time you will not be able to get 30 minutes outside of Cleveland without seeing a field of green.
The smaller farmers now have to turn their attention to the smaller tools and storage units. Many, like my next door neighbor above, will also grow some hay and when you think of hay the first thing that comes to mind is a pitchfork for spreading it out. I have a pitchfork too. But it its a bit different. A Pitchfork that can be useful in the stock market as a tool.

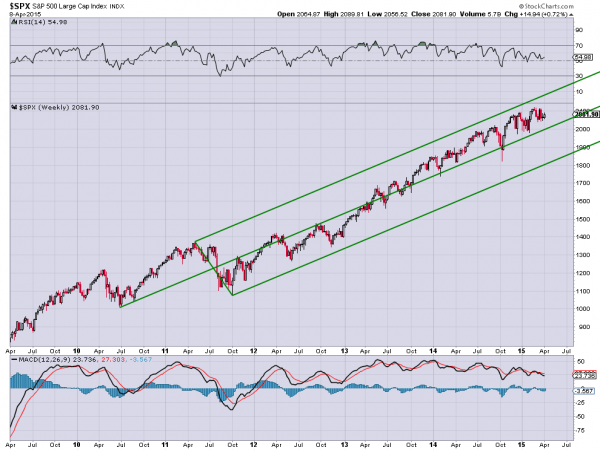
The Andrews’ Pitchfork tool is a very simple tool for determining a trend and the risks to that trend. The chart below shows the Andrews’ Pitchfork applied to the weekly chart of the S&P 500. From the base of the handle at the 2010 low the spread of the tines covers the major pullback of over 20% in 2011. What has happened since then? A steady move higher along the lengthening tines of the Pitchfork.
These are known as Median Lines. And the price moved over the Median Line in early 2013 and has remained between the Upper Median Line and the Median Line ever since. This is a strong trend higher. And even a move under the Median Line would still have plenty of room below to the Lower Median Line to remain bullish. This is a good way to understand the strength of a trend and the risk to it on a very large scale. And there is nothing that says anything but strength in this picture.
The information in this blog post represents my own opinions and does not contain a recommendation for any particular security or investment. I or my affiliates may hold positions or other interests in securities mentioned in the Blog, please see my Disclaimer page for my full disclaimer.
