ECB President Draghi yesterday said in Washington some of the lines that people had been looking for him to say following last week’s ECB meeting in Naples. His main point was that “we are accountable to the European people for delivering price stability, which today means lifting inflation from its excessively low level. And we will do exactly that.” He gave the deflation version of his “do whatever is necessary” pledge about the euro.
How does he plan to achieve that goal? He repeated his oft-said phrase that the ECB Governing Council is unanimous in its commitment to take more unconventional measures if necessary, but this time he talked more about the balance sheet than he did after the ECB meeting. Most significant, he said “we are ready to alter the size and/or the composition of our unconventional interventions, and therefore of our balance sheet, as required.” This was the phrase we had been waiting to hear last week. It’s a code phrase meaning that the ECB is willing to do quantitative easing by buying sovereign bonds (which they haven’t bought before, which is why it would alter the composition of their balance sheet). His comments indicate that the absence of any new measures last week was merely a pause and did not mark the end of the ECB’s efforts to fight deflation. This was all what the EUR bears wanted to hear and it turned the currency around.
Fed officials on the other hand were discussing just how long a “considerable time” to leave rates low is. Vice Chairman Stanley Fischer said that it was anywhere from two months to a year and that the market’s forecasts for an increase in rates “somewhere” in mid-2015 are correct. San Francisco Fed President John Williams agreed that that timeframe is a “reasonable guess,” but stressed that it all depends on the data. St. Louis Fed President James Bullard on the other hand said he thought the markets had it wrong and that rates would rise earlier, in Q1 2015. However the inflation market is forecasting that CPI inflation will be less than 1.5% in 2015, with core PCE at 1.25%, which is around 100 bps lower than what Bullard is forecasting, so he is an outlier. We will probably hear plenty more on this topic when four more Fed officials speak this evening (see below).
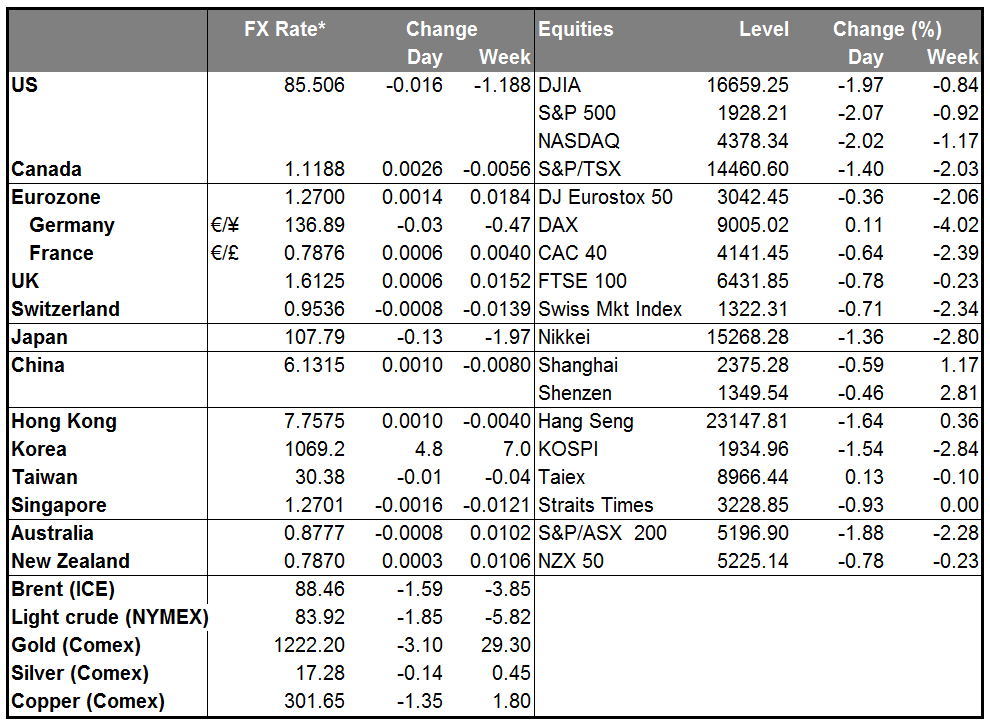
I mentioned yesterday that volatility is coming back. Note that the S&P 500 was down 1.5% Tuesday, up 1.8% on Wednesday (the biggest gain since October 2013), and down 2.1% yesterday. Really volatile! The decline yesterday seems to be due to fears that the global economy is slowing again and we are at risk of deflation (easy to understand if you look at the recent indicators from Germany) but with policy rates at zero already, there’s little that central bankers can do to save us this time. Crude Oil prices are plunging, in part on fears of weaker global activity, and that is hitting energy stocks, which then lead the stock market as a whole down. This is although lower oil prices leave consumers with more money to spend and so are good for overall demand.
I think this is a risk scenario for the commodity currencies. AUD, NZD and CAD are the currencies that are most vulnerable to a slowdown in global growth and so would tend to weaken most in this environment. SEK too tends to weaken along with growth indicators. RUB of course is also particularly vulnerable within the EM currencies.
Today’s indicators: During the European day, Norway’s inflation rate for September is forecast to have risen, but to remain fracusdtionally below Norges Bank inflation target of 2.5%. Expectations of a rise in Norway’s inflation could prove NOK-positive.
In the UK, we get the construction output for August and the consensus is for the monthly figure to accelerate. The country’s trade balance for August is also coming out and the forecast is for the deficit to narrow a bit.
Canada’s unemployment rate for September is expected to remain at 7.0%. However, the point of interest will be the change in employment for the same month, which is expected to turn to positive again. For the last couple of months the employment figure has been switching from positive to negative and back again. If this pattern continues and the release beats the estimate, we will most likely see CAD strengthening like the previous times.
We have plethora of speakers on Friday’s agenda. Four Fed members speak: Philadelphia Fed President Charles Plosser, Kansas City Fed President Esther George, Dallas Fed President Richard Fisher and Richmond Fed President Jeffrey Lacker. ECB Vice President Vitor Constancio and Norges Bank Governor Oystein Olsen also speak.
The Market
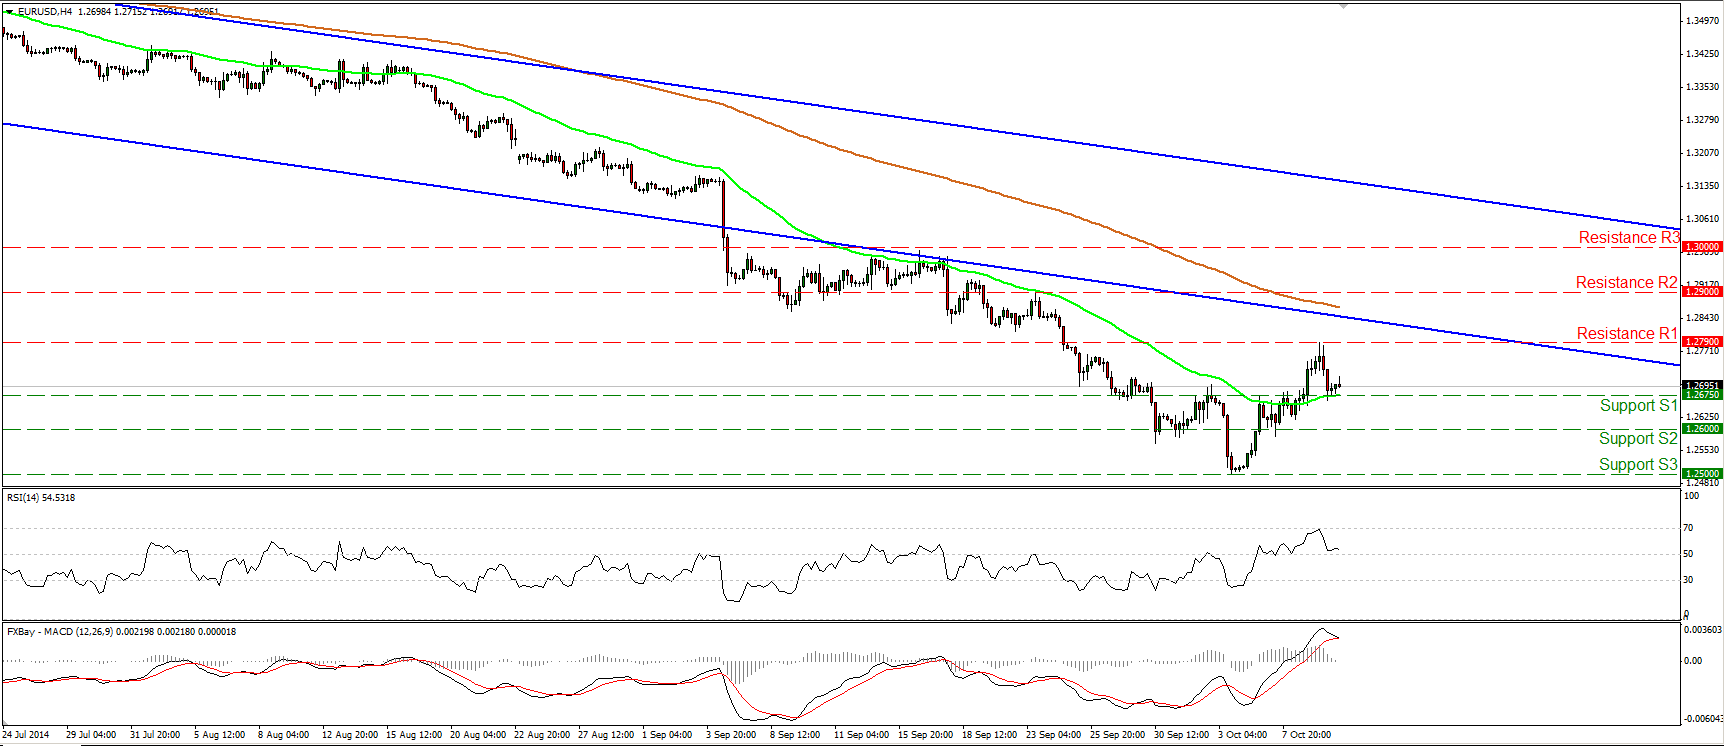
EUR/USD lower after hitting 1.2790
EUR/USD declined yesterday after finding resistance at 1.2790 (R1). However, the decline was halted by the 50-period moving average and the 1.2675 (S1) line. In my opinion, as long as the support line of 1.2600 (S2) holds, I still see the likelihood of a higher low. A clear move above the 1.2790 (R1) barrier could perhaps target the next resistance line at 1.2900 (R2). On the daily chart, our momentum studies support the notion. The positive divergence between the RSI and the price action is still in effect, while the MACD, although negative, remains above its trigger line. Nevertheless, the broader trend remains to the downside since the price structure remains lower peaks and lower troughs below the 50- and the 200-day moving averages. As a result I will treat this week’s up wave or any extensions of it as a corrective phase for now.
• Support: 1.2675 (S1), 1.2600 (S2), 1.2500 (S3)
• Resistance: 1.2790 (R1), 1.2900 (R2), 1.3000 (R3)
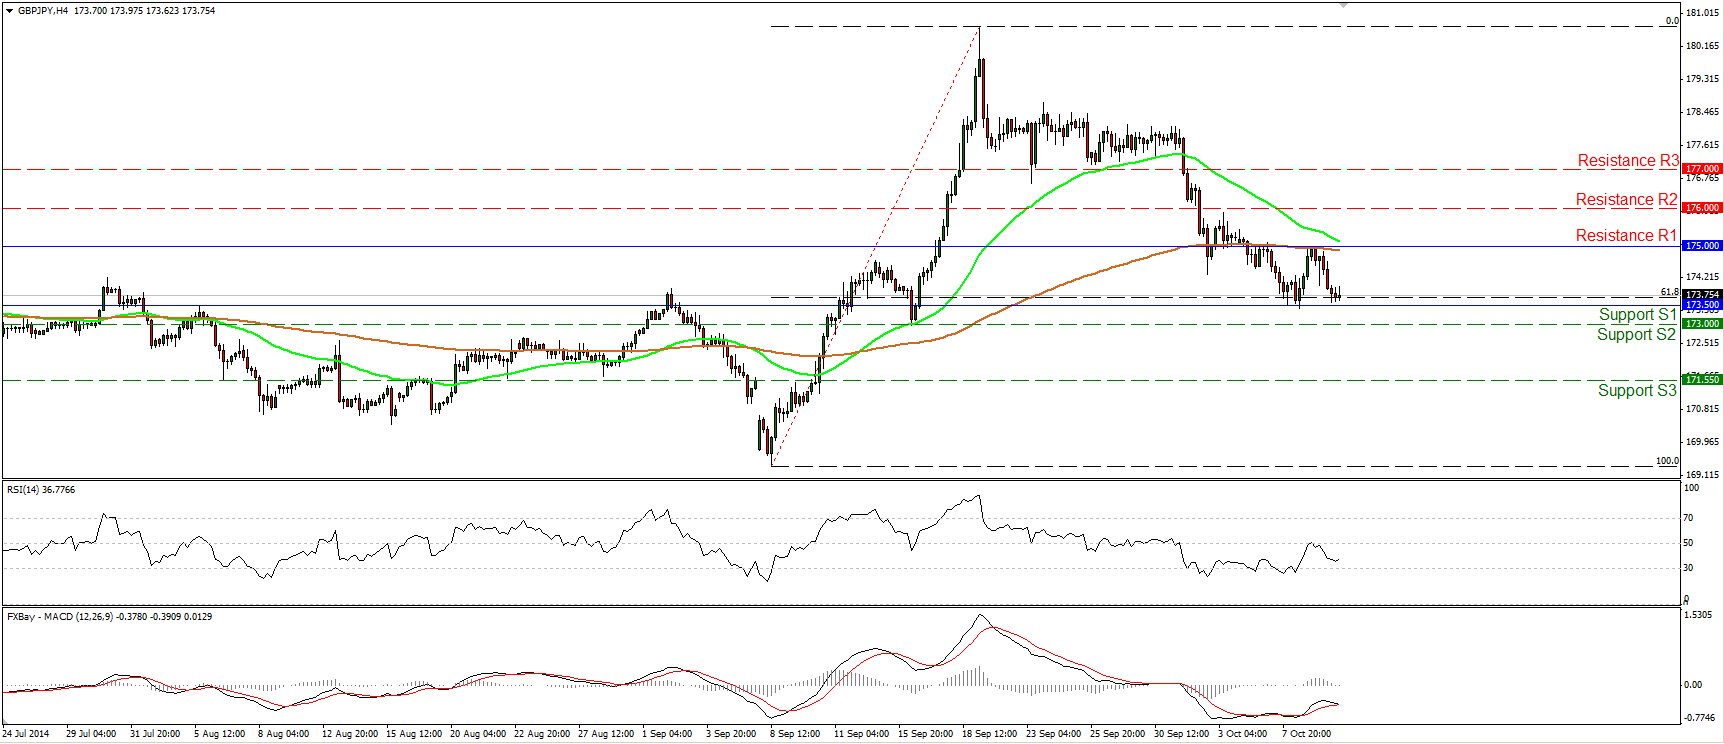
GBP/JPY within a near-term range
GBP/JPY moved lower after finding resistance at the 175.00 (R1) line and the 200-period moving average, but the down move was stopped near the 173.50(S1) line, which lies marginally below the 61.8% retracement level of the 8th – 19th of September up move. As long as the rate oscillates between these two lines I would adopt a neutral stance as far as the near-term picture is concerned. In the bigger picture, the rate remains above the upper bound of the broadening formation, completed on the 11th of September, and above the 200-day moving average. Thus, in the absence of any major bearish trend reversal signals, I would see a cautiously positive overall picture and I would treat the 19th Sep. - 8th Oct. down wave or any extensions of it as a corrective move.
• Support: 173.50 (S1), 173.00 (S2), 171.55 (S3)
• Resistance: 175.00 (R1), 176.00 (R2), 177.00 (R3)
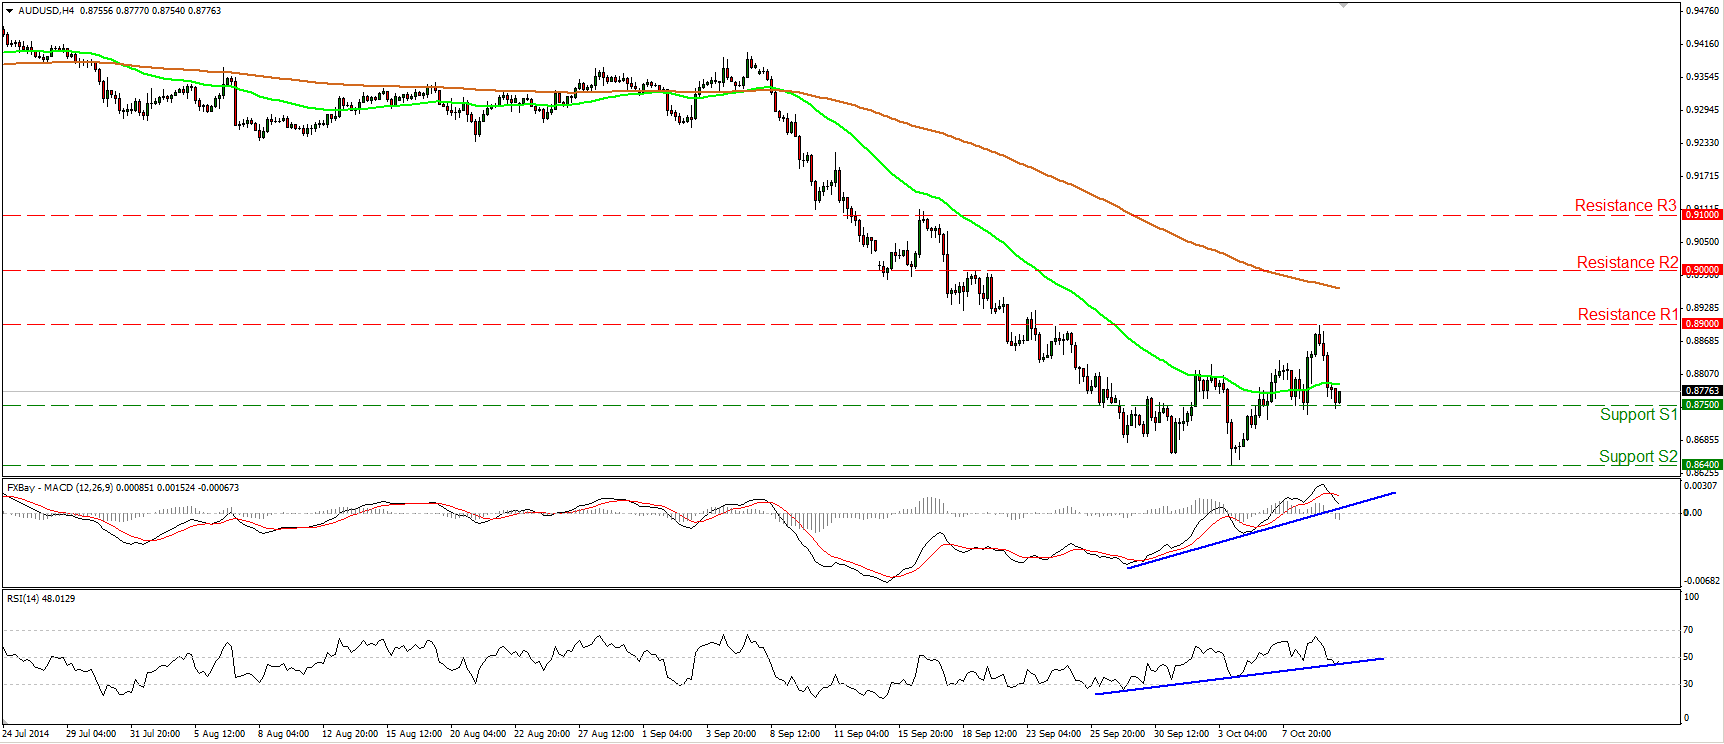
AUD/USD finds resistance at 0.8900
AUD/USD tumbled after hitting the 0.8900 (R1) line to find support at 0.8750 (S1). Although I still consider the overall trend of this pair to the downside, since the positive divergence between our oscillators and the price action is still in effect, the upside correction may have further to go. Our daily momentum studies also support the notion. The 14-day RSI moved higher after exiting its oversold territory, while the MACD has bottomed and moved above its signal line. As a result, I would take the sidelines for now and I would wait for the bears to give more actionable signs that the downtrend is back in force.
• Support: 0.8750 (S1), 0.8640 (S2), 0.8565 (S3)
• Resistance: 0.8900 (R1), 0.9000 (R2), 0.9100 (R3)
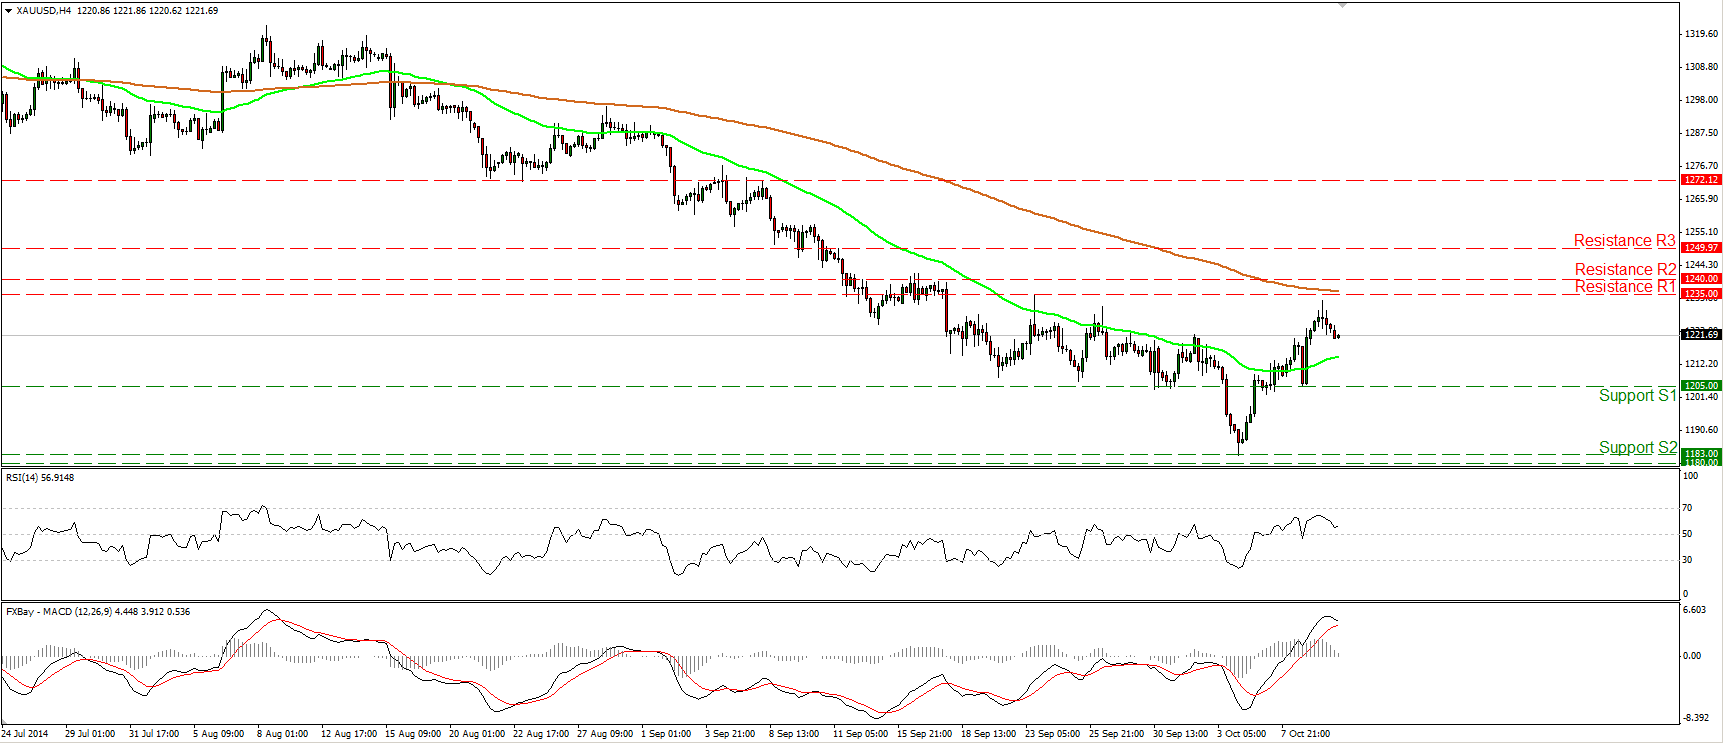
Gold finds resistance marginally below 1235
Gold continued higher on Thursday, but after finding resistance a couple of dollars below our resistance line of 1235 (R1), it pulled back. The RSI moved lower after finding resistance below its 70 line, while the MACD has topped and appears ready to cross below its signal in the close future. Taking these signs into account, I would be cautious of further pullback. However, as long as the support line of 1205 holds, the possibility for a higher low still exists, thus I would see a mildly positive near-term picture. As far as the broader trend is concerned, I would maintain my “wait and see” stance for the same reasons I mentioned in my previous comments. On Monday, the metal rebounded strongly from the critical support zone of 1180/83, defined by the lows of June and December 2013, but the absence of any bullish trend reversal signals makes it too early to argue about any uptrend scenarios, in my view.
• Support: 1205(S1), 1183 (S2), 1180 (S3)
• Resistance: 1235 (R1), 1240 (R2), 1250 (R3)
WTI continues plunging
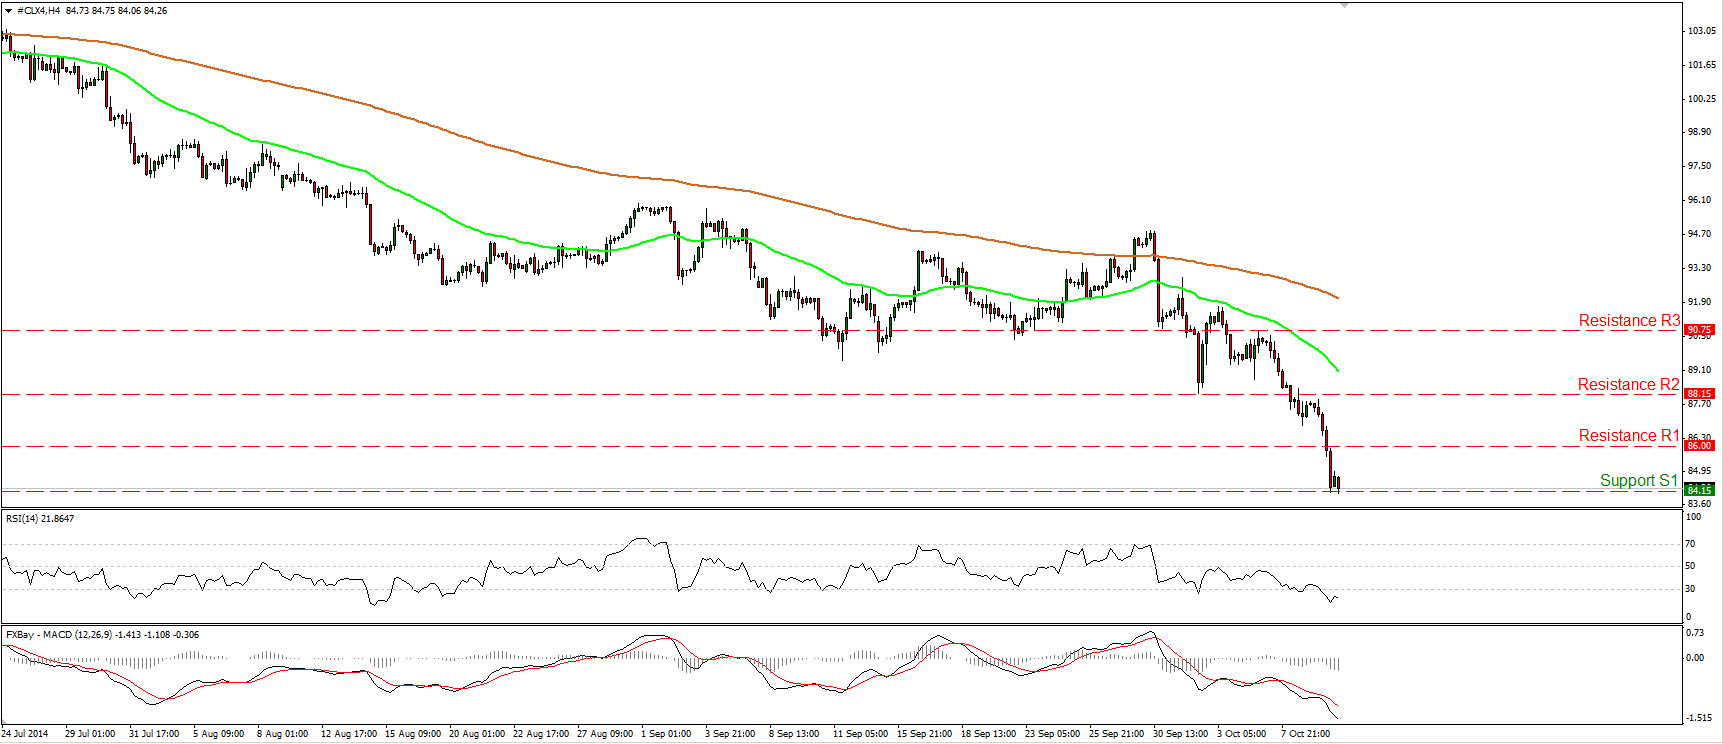
WTI collapsed on Thursday, reaching and breaking below our support line (turned into resistance) of 86.00. The decline was halted by our next hurdle at 84.15 (S1). Another break here could pull the trigger for extensions towards the 82.00 zone, defined by the low of the 2nd of July 2012. The RSI lies within its oversold territory but is pointing down, while the MACD remains below both its trigger and signal lines. These designate accelerating bearish momentum and amplify the case for further declines in the near future. On the daily chart, as long as the price structure remains lower highs and lower lows below both the 50- and the 200-day moving averages, the overall trend remains to the downside.
• Support: 84.15 (S1), 82.00 (S2), 80.00 (S3)
• Resistance: 86.00 (R1), 88.15 (R2), 90.75 (R3)

