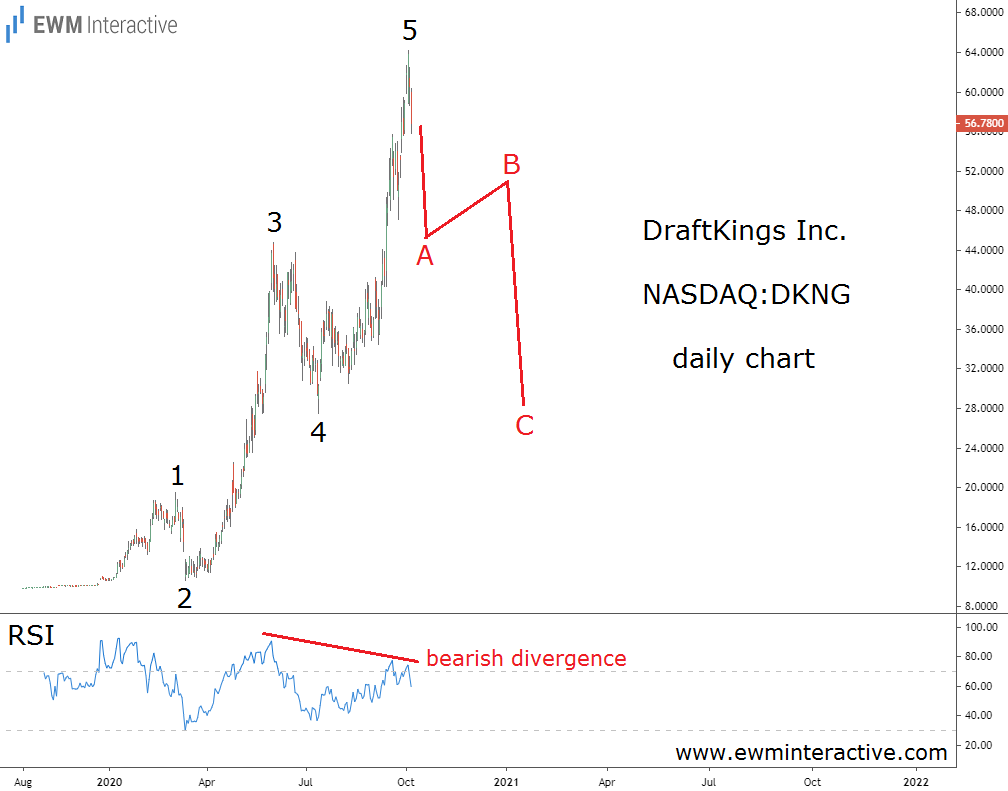
It’s been almost three and a half months since we examined DraftKings (NASDAQ:DKNG) stock in October, 2020. The share price was hovering near $57 after a strong run from $10.60 to over $64 in just several months. The regulatory environment in the U.S. seemed to be warming up and many analysts hurried to issue their BUY ratings on the stock.
Instead of joining the bull team, however, we decided to first take a look at DraftKings’ price chart. The Elliott Wave pattern we found there quickly convinced us it was better to simply stay aside. See it below.

The daily chart of DraftKings stock revealed a complete five-wave impulse, labeled 1-2-3-4-5. According to the theory, a three-wave correction follows every impulse. In addition, there was a clear bearish RSI divergence between waves 3 and 5. In all likelihood, a notable plunge was supposed to erase most or all of wave 5.
Three Months Later, DraftKings Remains Under Elliott Wave Influence
Good news has been pouring over since we published this analysis on Oct. 7, 2020. Pennsylvania, New York and Michigan, among others, signaled readiness to allow sports betting and Canada was also opening up. The NBA was also reportedly looking for a sports betting partner. Unfortunately, you couldn’t have guessed all that by looking at DKNG stock.

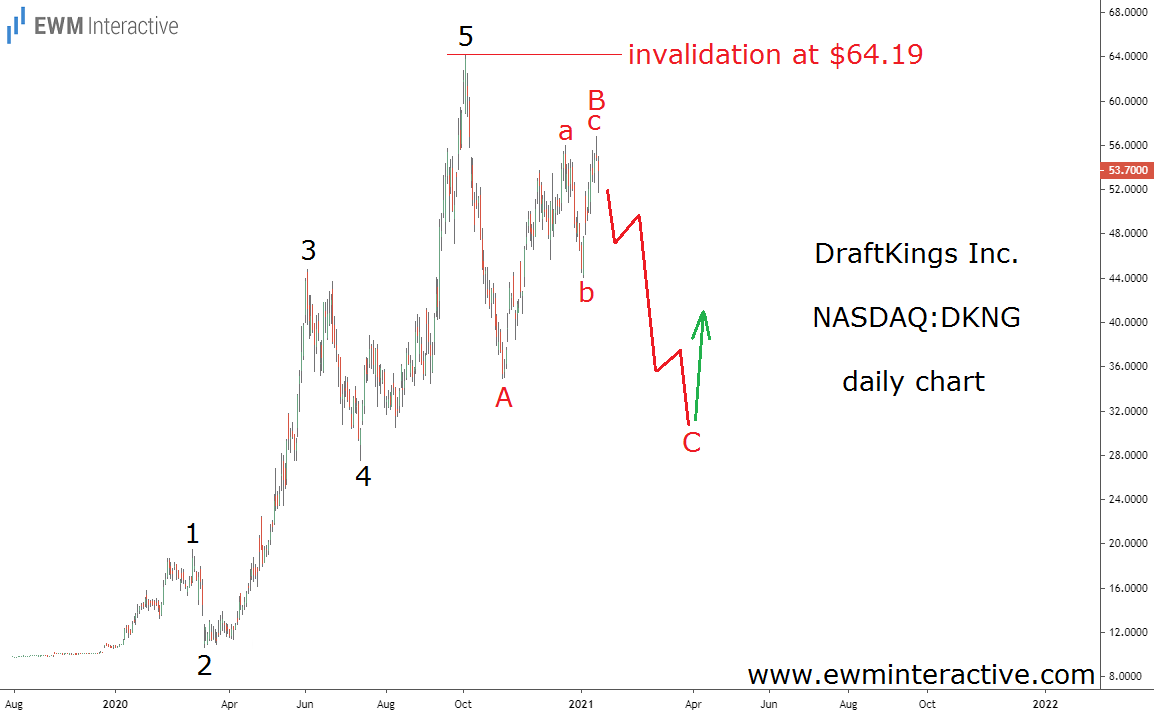
The price started falling almost right away. By the end of October, it was below $35, losing over 38% in less than a month. The drop from $64.19 to $34.90 was sharp, fast and homogeneous, which makes us think it was just wave A of a larger A-B-C zigzag correction.
This means the three-wave a-b-c recovery to $56.77 must be wave B. If this count is correct, another major decline of roughly 40% can be expected in wave C. Targets below the bottom of wave A make sense as long as DraftKings stock trades below the top of wave 5 at $64.19. In our opinion, the bulls would have a much better chance in the low $30s, but not now near $54 a share.
