Leading homebuilders like D.R. Horton, Inc. (NYSE:DHI) and PulteGroup, Inc. (NYSE:PHM) have been riding high on affordable mortgage interest rates, pent-up demand, employment gains, income growth and favorable industry trends. The home building industry has a solid Zacks Industry Rank (top 14% out of 256 industries). The industry has outperformed the broader market (S&P 500) so far this year as well.
Meanwhile, the July existing-home sales were down 1.3% from June owing to low supply and increased prices. Nevertheless, July’s sales pace is 2.1% higher than a year ago. Again, improving labor markets, falling unemployment rates and a limited home supply are supporting a continued rise in home prices, thereby boosting homebuilders’ top line.
Among the top performers, since D.R. Horton and PulteGroup are in close competition, let us analyze the factors to determine which company is a better investment option in this macroeconomic scenario. Since both the companies carry a Zacks Rank #3 (Hold), we need to delve deeper into factors beyond rank.
Price Performance
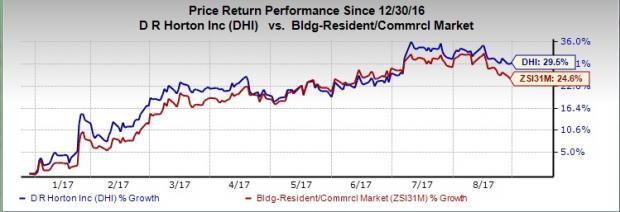
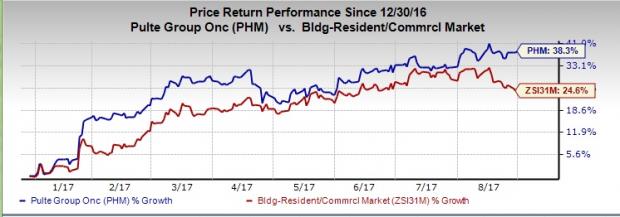
D.R. Horton has gained 29.1% so far this year, while PulteGroup’s shares have increased 37.7%. That said, we noticed that both the companies have outperformed the industry in each of the 4-week, 12-week and 52-week time frames, earning a Momentum Score of B. While both the stocks have also outperformed the S&P 500 average so far, PulteGroup clearly scores higher than D.R. Horton.
D.R. Horton Vs. Industry

PulteGroup Vs. Industry

Estimate Revisions
PulteGroup’s current year estimate revisions have been discouraging with estimates decreasing from $2.18 a share to $2.09 over the last 60 days.
D.R. Horton’s current year figures look quite promising. For fiscal 2017, 12 estimates have moved higher for D.R. Horton while four have gone lower in the past 60 days. The consensus trend has been pretty favorable too, with estimates increasing 1.1% from $2.75 a share to $2.78 over the last 60 days. D.R. Horton expects to perform reasonably well in fiscal 2017 and 2018 on the back of its robust backlog position and well-stocked inventory of land, lots and homes.
Earnings Growth
PulteGroup has remarkably beaten earnings estimates in five of the trailing six quarters, recording an average beat of 11.5%. D.R. Horton on the other hand surpassed estimates in four of the last six quarters at an average of 4.7%.
PulteGroup makes a better pick in terms of growth investment. Arguably, nothing is more important than earnings growth as surging profit levels are often an indication of strong prospects.
While PulteGroup has a historical EPS growth rate (average trailing 12-month EPS growth rate over the last 3-5 years of actual earnings) of 40.7%, D.R. Horton has registered historical EPS growth of 16.8%. The industry registered historical EPS growth of 28.5%.
Coming to current year’s EPS growth, PulteGroup is looking to grow at a rate of 23.8% more than D.R. Horton’s 17.6%.Meanwhile, their industry calls for EPS growth of 17.9%. PulteGroup’s investments in the acquisition of new land positions result in improved volumes, revenues and profitability.
Revenue Growth
PulteGroup sales growth in 2017 is projected to be about 15.7% almost on par with D.R. Horton’s projected rate of 16.4%, both more than the industry’s average of about 8%.
Apart from prudent capital allocation, PulteGroup is taking actions to improve its operating and financial performance. The initiatives include improving overhead leverage, increasing inventory turns and implementing new pricing strategies. These initiatives have enabled PulteGroup to drive revenues.
D.R. Horton is confident about the rest of fiscal 2017, courtesy of 27,600 homes in inventory at the end of June and a robust supply of lots. The company lifted its fiscal 2017 view for total revenues, homes delivered and overall pre-tax profit margin. The company maintains a positive outlook for revenues and profits, both of which are expected to increase double digits, annually.
Valuation Metrics
Going by the trailing 12-month Price-to-book (P/B) multiple, both stocks are a tad overvalued, as is evident from their P/B ratios compared with that of the industry’s. P/B ratios for PulteGroup and D.R. Horton are 1.69 and 1.78, respectively, while the industry’s stands at 1.19. PulteGroup’s stock is slightly cheaper than D.R. Horton’s.
Land Investment Strategy
D.R. Horton invested $2.8 billion in lots, land and development in the first nine months of fiscal 2017, compared with $2 billion a year ago. The company plans to boost investments to replenish its land and lot supply in 2017 to support revenue growth. It has selectively invested in attractively-priced land and lots in the past two years allowing it to bring new attractive communities in desirable markets. D.R. Horton’s well-stocked supply of land, plots and homes provide it with a strong competitive position to meet the demand in future quarters, thereby growing sales and home closings.
In the second quarter of 2017, PulteGroup invested approximately $236 million in the acquisition of new land positions. For the first quarter, land investments totaled $566 million, excluding the purchase of John Wieland assets. PulteGroup’s land strategy now emphasizes on investing in shorter-lived smaller land assets while expanding the use of land option agreements when possible, thereby mitigating market risk. It also focuses on investing in land where demand is more sustainable and hence they generate better returns.
Final Thoughts
Going by the above factors, PulteGroup certainly has an edge over D.R. Horton in terms of earnings growth expectations, price performance and valuation. Add, favorable industry trends and a VGM Score of B to this, we believe that we have a good investment proposition in PulteGroup.
Other Key Picks
Apart from PulteGroup, investors interested in the homebuilding industry may also consider NVR, Inc. (NYSE:NVR) , sporting a Zacks Rank #1(Strong Buy) and KB Home (NYSE:KBH) carrying a Zacks Rank #2 (Buy). You can see the complete list of today’s Zacks #1 Rank (Strong Buy) stocks here.
NVR has an expected earnings growth of 33.9% for the current year. KB Home is expected to witness 51.7% rise in earnings, in fiscal 2017.
4 Surprising Tech Stocks to Keep an Eye On
Tech stocks have been a major force behind the market’s record highs, but picking the best ones to buy can be tough. There’s a simple way to invest in the success of the entire sector. Zacks has just released a Special Report revealing one thing tech companies literally cannot function without. More importantly, it reveals 4 top stocks set to skyrocket on increasing demand for these devices. I encourage you to get the report now – before the next wave of innovations really takes off.
See Stocks Now>>
PulteGroup, Inc. (PHM): Free Stock Analysis Report
KB Home (KBH): Free Stock Analysis Report
D.R. Horton, Inc. (DHI): Free Stock Analysis Report
NVR, Inc. (NVR): Free Stock Analysis Report
Original post
Zacks Investment Research
