📈 Will you get serious about investing in 2025? Take the first step with 50% off InvestingProClaim Offer

Dr. Copper Needs An Antidote

Published 02/26/2020, 12:42 AM
Updated 07/09/2023, 06:31 AM
HG
-
SSEC
-

The following weekly chart of Copper shows that its price has fluctuated wildly around the 2.47 level in an increasingly narrowing triangle formation since the end of the 2008 global financial crisis. At the moment it's acting as major support and happens to coincide with the triangle apex. A drop and hold below this level could see a sharp downdraft in this commodity to around 2.20 (price support combined with the bottom of the triangle and a secondary volume bump), or lower.

Major overhead resistance sits at the confluence of the 50 & 200-month moving averages with the Volume Profile POC around 2.70. A spike and hold above this level could see price rise to around 2.99 (price resistance combined with the top of the triangle and a secondary volume bump), or higher.
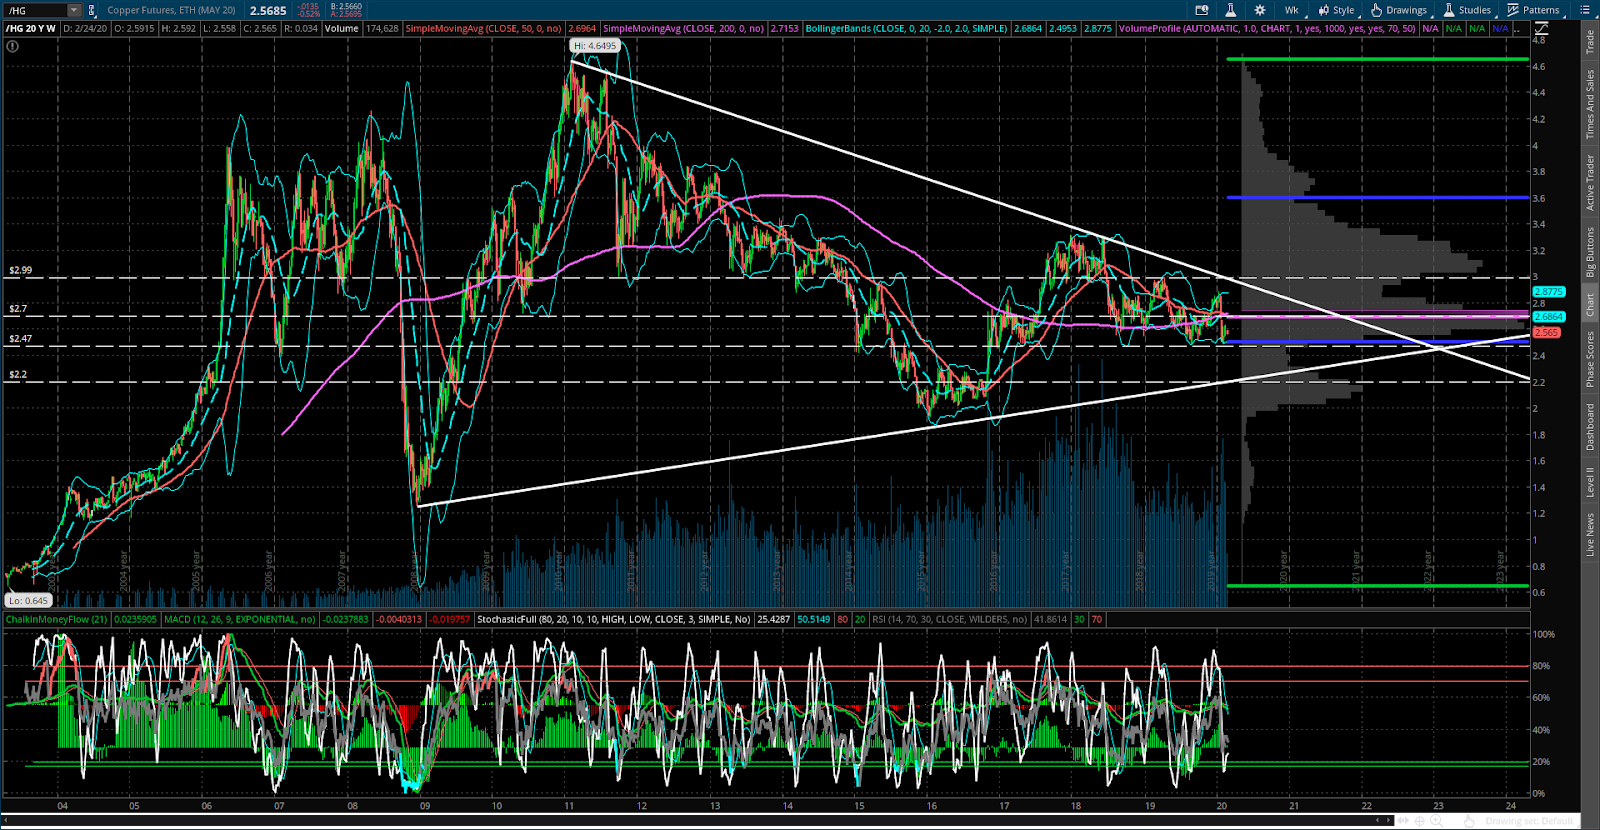
HG 20 Y Weekly Chart

Until such time as price breaks through either of these barriers and holds, I'd watch for increasing volatility in the near term.

The technicals are giving mixed signals on the daily chart as to breakout direction.

On a negative note, the RSI is trading below 50, while the MACD and PMO have recently formed a bullish crossover, and a bullish Golden Cross has formed on the moving averages...albeit on a recent weak and tentative price bounce.

These technicals can be monitored for confirmation and sustainability of either directional breakout. They must, either, hold on a rally (and the RSI must break and hold above 50), or reverse on a drop in price on this short-term timeframe.
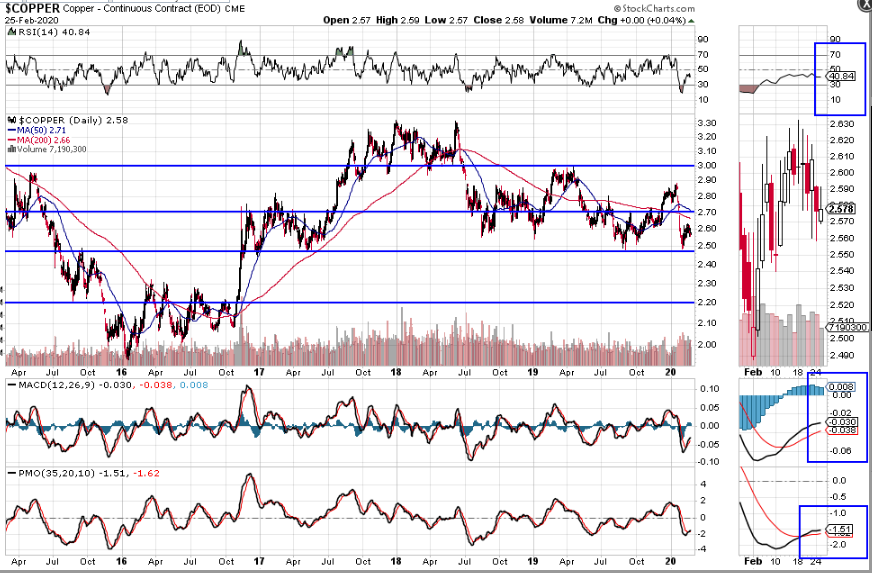
Copper Daily Chart

Finally, COPPER has, historically, mirrored, more or less, China's Shanghai Index (SSEC) over the years, as shown on the following monthly comparison chart.

I last wrote about the SSEC in my post of February 3. Since then, it rallied and sits just above 3000, a level I had identified as major resistance.
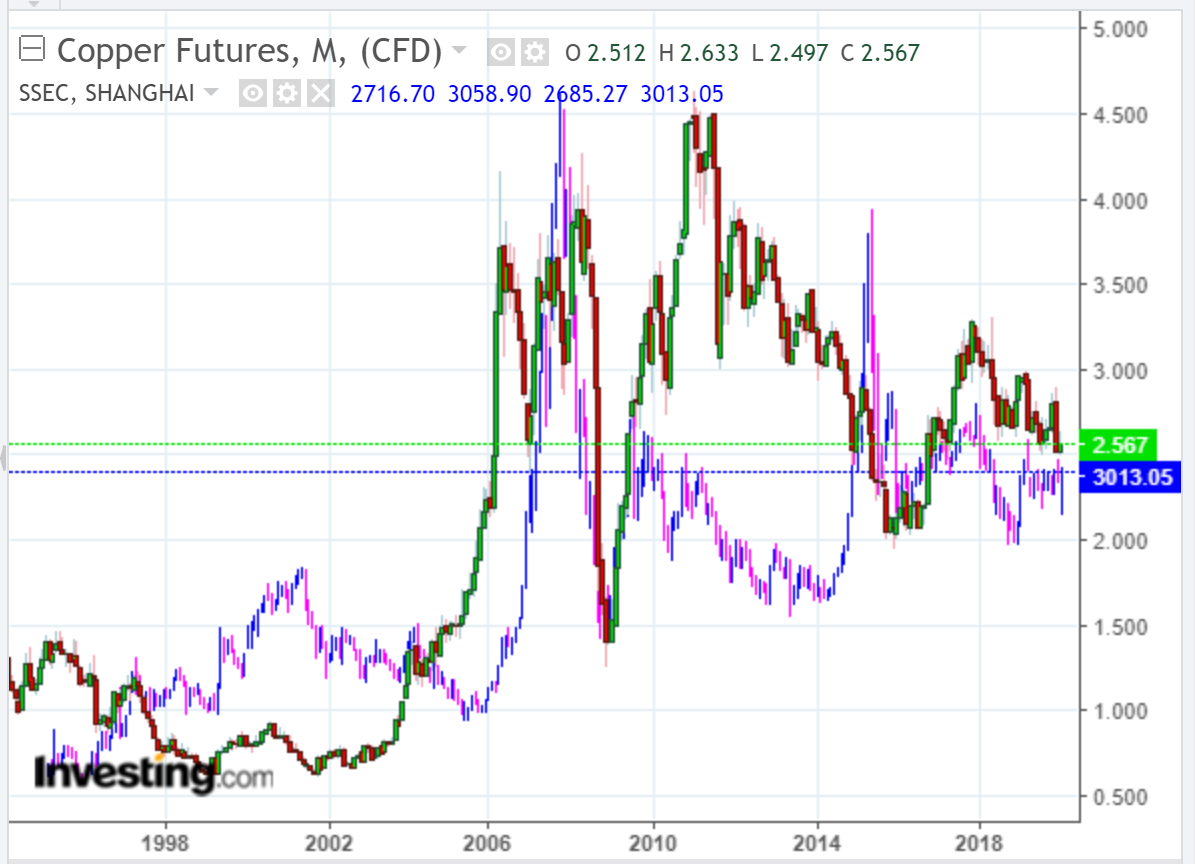
Copper Futures Monthly Chart

If it fails to hold above 3000, I'd watch for a sharp drop to 2500, or lower. If that happens, I'd predict that COPPER would also drop...another potential useful directional gauge.
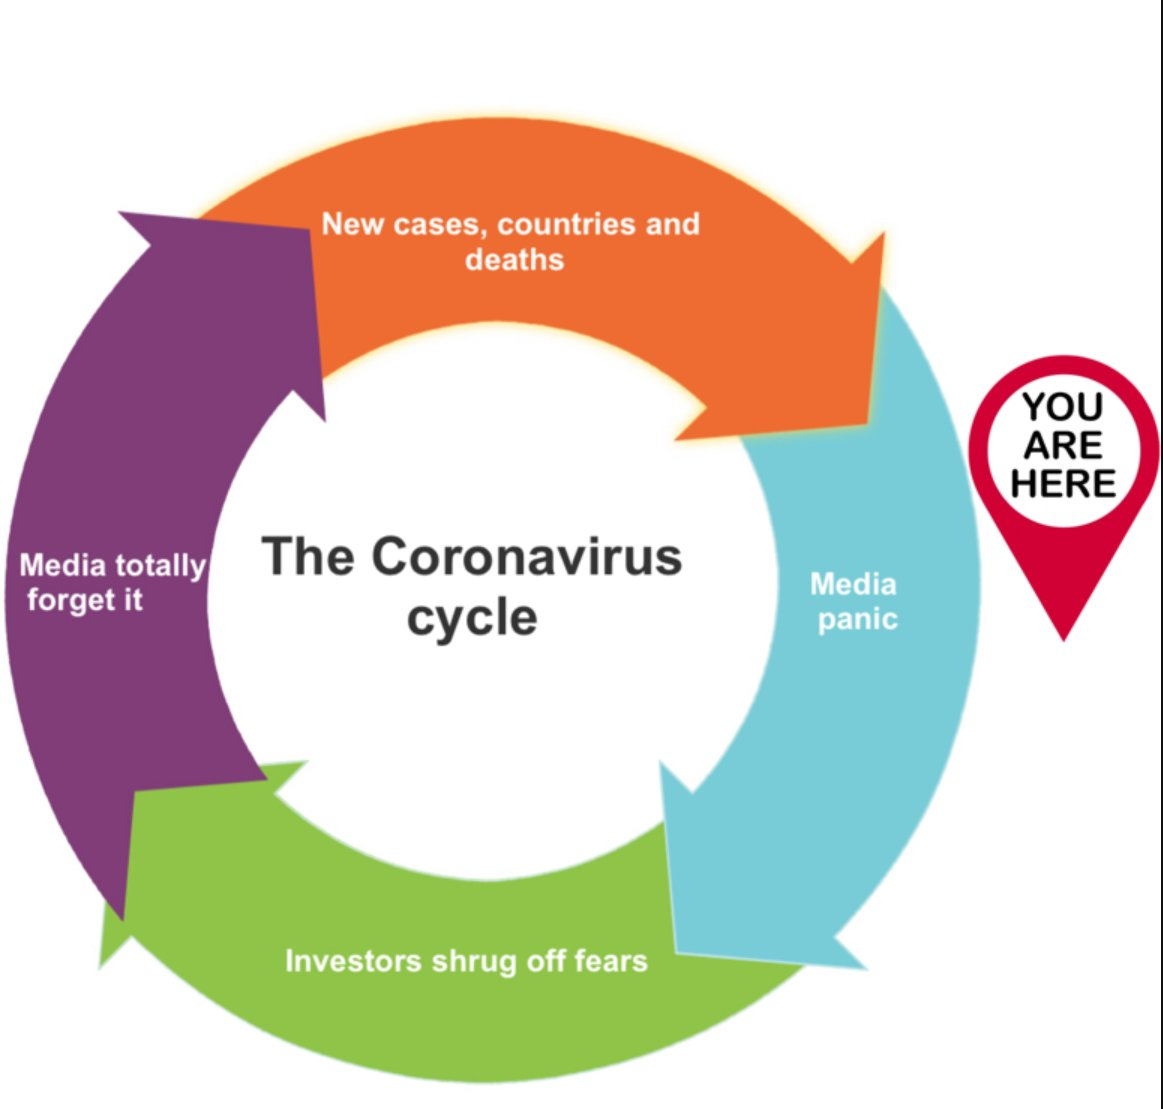
Coronavirus Cycle

Latest comments

Loading next article…
Risk Disclosure: Trading in financial instruments and/or cryptocurrencies involves high risks including the risk of losing some, or all, of your investment amount, and may not be suitable for all investors. Prices of cryptocurrencies are extremely volatile and may be affected by external factors such as financial, regulatory or political events. Trading on margin increases the financial risks.
Before deciding to trade in financial instrument or cryptocurrencies you should be fully informed of the risks and costs associated with trading the financial markets, carefully consider your investment objectives, level of experience, and risk appetite, and seek professional advice where needed.
Fusion Media would like to remind you that the data contained in this website is not necessarily real-time nor accurate. The data and prices on the website are not necessarily provided by any market or exchange, but may be provided by market makers, and so prices may not be accurate and may differ from the actual price at any given market, meaning prices are indicative and not appropriate for trading purposes. Fusion Media and any provider of the data contained in this website will not accept liability for any loss or damage as a result of your trading, or your reliance on the information contained within this website.
It is prohibited to use, store, reproduce, display, modify, transmit or distribute the data contained in this website without the explicit prior written permission of Fusion Media and/or the data provider. All intellectual property rights are reserved by the providers and/or the exchange providing the data contained in this website.
Fusion Media may be compensated by the advertisers that appear on the website, based on your interaction with the advertisements or advertisers.
© 2007-2025 - Fusion Media Limited. All Rights Reserved.