Dow Theory Sell Signal Near?

Published 08/04/2014, 12:34 PM
Updated 07/09/2023, 06:31 AM
DJI
-
DJT
-
DJUSUT
-

Dow Theory says the market is in an upward trend if one of its averages (industrial or transportation) advances above a previous important high and it is accompanied or followed by a similar advance in the other. The theory also says that when both averages dip below previous important lows, it's regarded as an indicator of a downward trend.

The 3-pack below looks at patterns in the Dow Jones IndustrialsDow Jones Utilities and the Dow Jones Transportation indices. Each chart demonstrates the trend is up, in each of these.
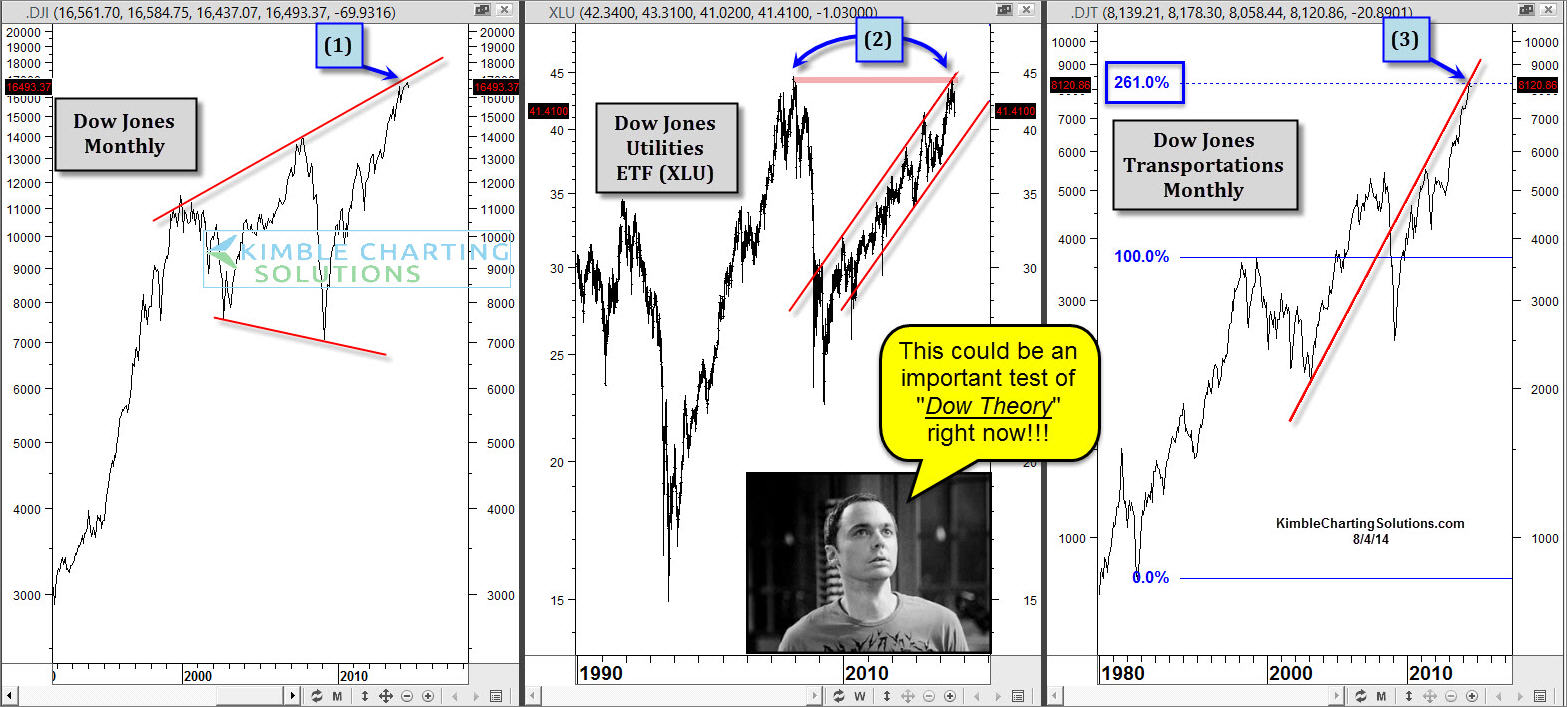
Dow Jones Industrials, DJ Utilities And DJ Trans

Each DJ index above remains in an uptrend, dating back a few years ... nothing to debate about the trends. These rallies have pushed each index up to unique long-term resistance tests that could be worth watching very closely!

Industrials (left chart) is up against mega-phone resistance, dating back to the 2000 highs at (1). Utilities ETF XLU (middle chart) could be creating a Double Top at (2). Transports are up against a steep resistance line and long-term Fibonacci Extension level at (3).

As mentioned earlier, the trend in each of these remains up, above their 200-MA lines.

In "theory" what these DJ Index's does over the next 4-6 weeks could become very important from a "Dow Theory" perspective, should these unique resistance lines end up impacting the quality upward trends that are in place.

Latest comments

Loading next article…
Risk Disclosure: Trading in financial instruments and/or cryptocurrencies involves high risks including the risk of losing some, or all, of your investment amount, and may not be suitable for all investors. Prices of cryptocurrencies are extremely volatile and may be affected by external factors such as financial, regulatory or political events. Trading on margin increases the financial risks.
Before deciding to trade in financial instrument or cryptocurrencies you should be fully informed of the risks and costs associated with trading the financial markets, carefully consider your investment objectives, level of experience, and risk appetite, and seek professional advice where needed.
Fusion Media would like to remind you that the data contained in this website is not necessarily real-time nor accurate. The data and prices on the website are not necessarily provided by any market or exchange, but may be provided by market makers, and so prices may not be accurate and may differ from the actual price at any given market, meaning prices are indicative and not appropriate for trading purposes. Fusion Media and any provider of the data contained in this website will not accept liability for any loss or damage as a result of your trading, or your reliance on the information contained within this website.
It is prohibited to use, store, reproduce, display, modify, transmit or distribute the data contained in this website without the explicit prior written permission of Fusion Media and/or the data provider. All intellectual property rights are reserved by the providers and/or the exchange providing the data contained in this website.
Fusion Media may be compensated by the advertisers that appear on the website, based on your interaction with the advertisements or advertisers.
© 2007-2025 - Fusion Media Limited. All Rights Reserved.