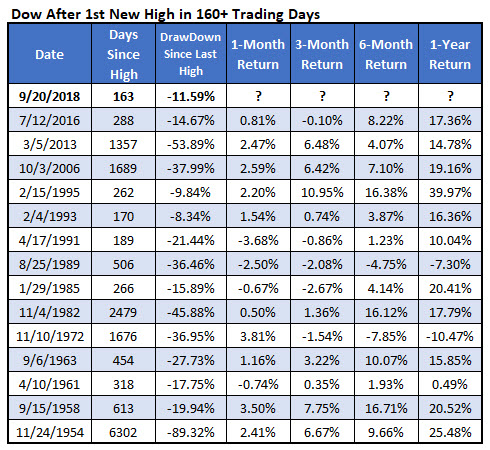
While the Nasdaq and S&P 500 have been exploring record highs for some time now, the Dow Jones Industrial Average (DJI) was a bit slower to catch up. Specifically, the Dow on Thursday touched a new record high for the first time since Jan. 26 -- that's 164 trading sessions between all-time highs, marking the longest stretch since a string of 288 days that ended July 12, 2016. However, this could be a bullish signal for the blue-chip barometer, if past is prologue.
There have been just 14 other times where the Dow went at least 160 trading days between record peaks. The longest stretch ever was more than 6,300 sessions, starting during the Great Depression and ending in November 1954, per data from Schaeffer's Senior Quantitative Analyst Rocky White. The DJI fell more than 89% from peak to trough during that stretch, per the "drawdown since last high" column on the chart below. This time around, the index was down just 11.59% at its bottom.

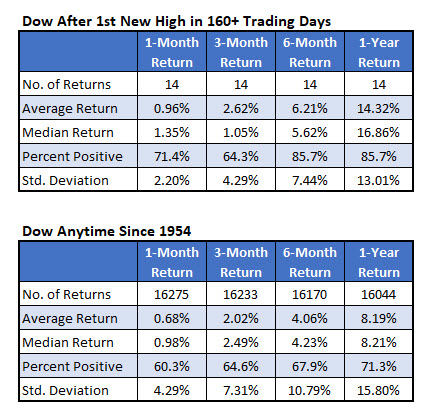
After these relatively lengthy stretches between record highs, the Dow tends to outperform. One month later, the index was up nearly 1%, on average, and higher 71.4% of the time. That's compared to an average anytime one-month gain of just 0.68%, and a win rate of 60.3%, looking at DJI data since 1954 (the time of the first signal).
Six months and one year later, the index was also up by much more than usual. Specifically, the DJI was higher by 6.21% and 14.32%, on average, respectively, compared to anytime gains of 4.06% and 8.19%. Plus, the Dow was in the black 85.7% of the time at both post-signal checkpoints, compared to average anytime six-month and one-year win rates of 67.9% and 71.3%, respectively.

