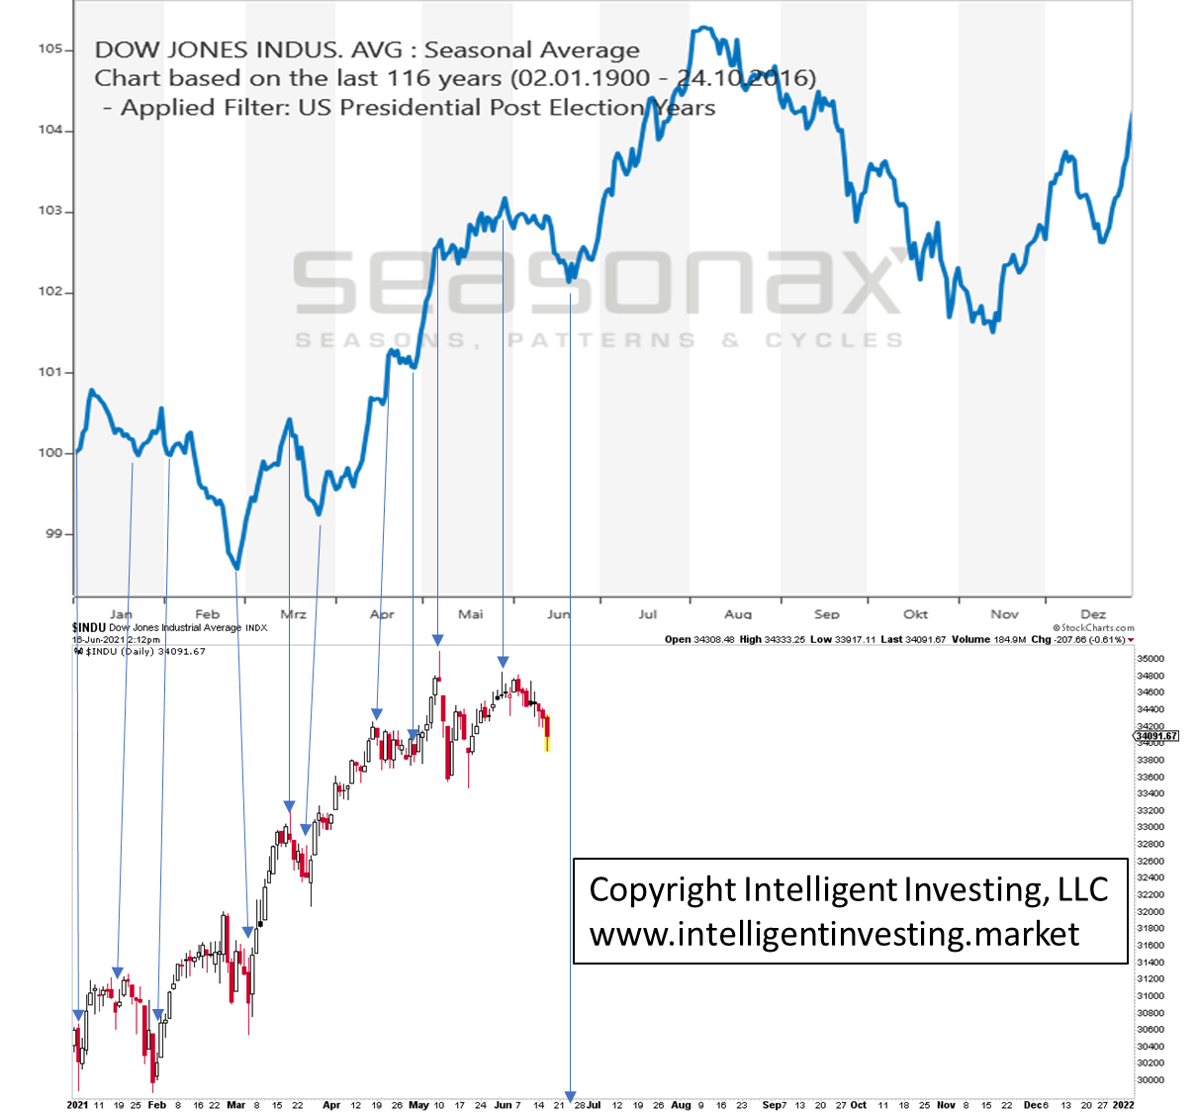
Using data since 1900, one can construct “seasonal average” patterns for each four-year presidential election cycle. As 2021 is a post-election year and, despite all the FED’s “it is not quantitative easing” $100 billion per month, the Dow Jones Industrial Average has followed the average seasonal average pattern rather well. See Figure 1 below.
It makes me wonder what is driving markets? The Y-axis shows the average percentage change. But what matters more is the timing of the highs and lows.
Figure 1. Dow Jones Average Post-Election Year pattern and daily YTD chart

It follows that not all highs and lows exactly match in time. (See blue arrows.)
Still, the differences are minimal. And remember, we are talking about an average pattern of 20 elections, not about absolutes. Therefore, the bottom line is to expect a significant low some time next week before the next rally commences that takes the index to new all-time highs into early July.
After that high, we should – assuming the current market continues to follow the average pattern as it has and there is currently nothing to suggest it will not – expect a multi-month correction. Albeit, not shown here, but from an Elliott Wave Principle (EWP) perspective, I expect the pending low to be a smaller degree (intermediate) 4th wave; the rally into July the last 5th wave of a more significant (major) 3rd wave, and the correction into the fall should be major-4, with a major-5 to follow into 2022. That should then complete the bull market that started in March 2020.
