Dow Jones Industrial Average Looks To Be On Steroids Touching New Highs! But It Is Time To Stay Alert
In the mid of October 2014 US Equity market Dow Jones Industrial Average showed one of the sharpest rally from the level of 15855 to 17894 levels. US FED also closed down its massive Bond Buying program however Equity markets were less affected by such news and continued to move higher. This suggests that Equity markets are constantly looking at the future and expecting that the US Economy may see revival in coming years. However, concern remains as the QE 3 was started by US FED in 2008 during the financial crisis but till now no major recovery is seen in US Economy. So what if Economy fails to recover and what will be the reaction of markets?
On the other side Commodity downfall suggests that still there is no increase in demand post Financial Crisis of 2008. Japan is struggling against deflationary crisis. China has cut the interest rates to stimulate the Economy. These are the factors which one should not ignore while making any investment in any asset classes.
We have been applying Elliott wave theory to forecast the future trend. “The Global Waves Short Term Update”covers Dow Jones Industrial Average, EUR/USD, Comex Gold and Silver.
Recently US Equity market has been struggling near the psychological level of 18000. What are important levels to watch from short term perspective?
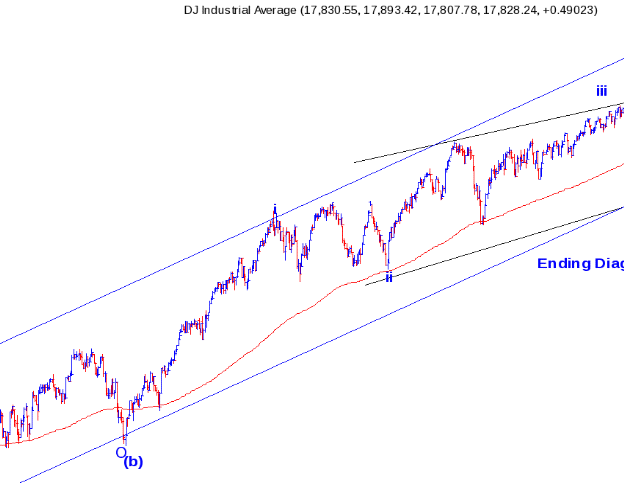
DJIA daily chart:

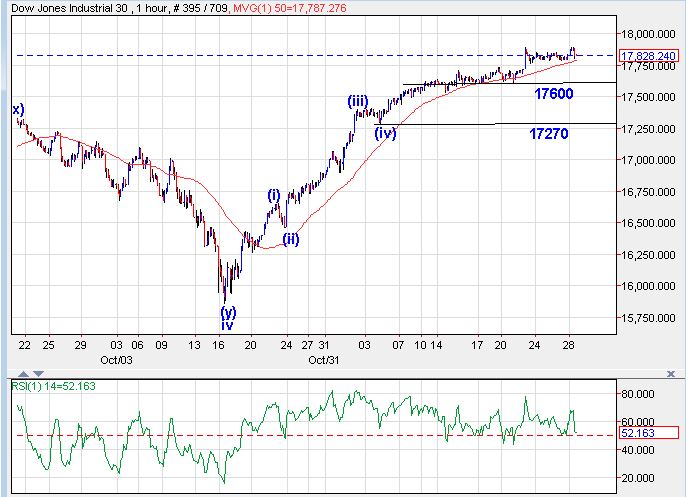
DJIA 60 mins chart:

(Part of research published in the evening of 1st December 2014) The Global Waves Short Term Update get important turning points for Dow Jones Industrial Average, EUR/USD, COMEX Gold (NYSE:IAU) and COMEX Silver (TO:HUZ) along with applied Elliott wave counts.
For Dow Jones Industrial Average, in the last trading session prices continued to move in range bound movement at life time highs and closed on the flat note. This prices movement has made 4th consecutive Doji candlestick pattern which suggest indecisiveness among the investors.
As shown in daily chart, bar technique continued to work very well on this index. In the entire up move which started from the level of 15850 levels not a single bar has given close below prior bars low which is a positive sign. Over short term any close below 17790 level will provide the first negative confirmation that trend is reversing on downside.
As shown in 60 mins chart, as per wave perspective, minor wave (v) is ongoing on upside which looks to be forming wedge pattern as momentum on upside in not building up. If this is right then faster move below 17760 followed by 17600 will confirm that downside correction has started. However any move above 17900 will continue to up move towards 18000 level but momentum will be key.
In short, Dow Jones Industrial Average is trading at crucial levels. Any move below 17600 will take prices towards 17270 levels where wave (iv) support is placed whereas any move above 17900 will take prices towards 18000 levels.
