📈 69% of S&P 500 stocks beating the index - a historic record! Pick the best ones with AI.See top stocks

Dow Jones Industrials: Topping Pattern Forming

Published 03/20/2019, 01:27 AM
Updated 07/09/2023, 06:31 AM
DJI
-
SPY
-

Our research team believes a moderately mild price rotation will unfold over the next 30 to 60 days where the U.S. stock market will rotate downward. Particularly, the Dow Jones Industrials should move lower towards the 23,000 to 24,000 range before finding support based on the longer term weekly chart. Keep in mind we are not saying the price is going to fall. We are stating price could correct in a big way if recent support levels are broken. If so, then 23,000-24,000 levels should be reviewed.

We have been warning about a specific price pattern that we believe is currently in the process of setting up in the U.S. stock market. This pattern is a “Falling Wedge” pattern. We’ve seen a few of these over the past 5+ years in downward retracing price swings. They typically act as a means for the price to explore a “momentum base” setup before breaking out to the upside. You can read our previous research here.

Price weakness could begin to drive market prices lower over the next few weeks as this right shoulder acts as critical resistance. If you have not already prepared for this move, please try to understand the importance of this long term price pattern. Head & Shoulders patterns are typically viewed as major resistance and a classic topping formation. Our belief that the downside price swing from the right shoulder is based on our predictive modeling systems results. We believe this move will drive prices lower before support is found and our downward sloping wedge pattern sets up. This wedge pattern will likely break to the upside during the summer months.
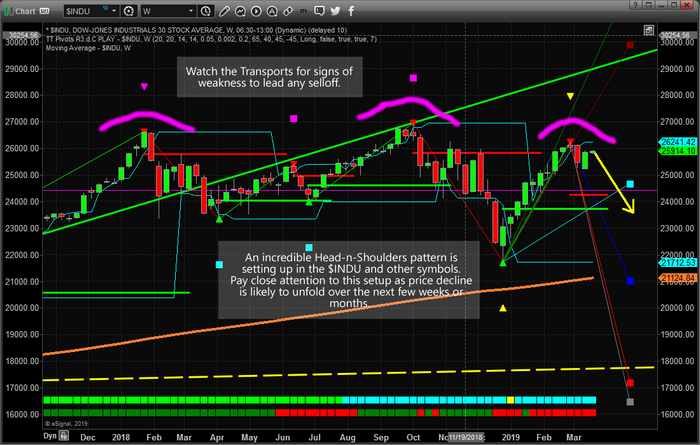
INDU Chart

This Head & Shoulders pattern is something all traders need to pay attention to. This is a critical resistance/top formation that should drive prices lower over the next few weeks/months.

Just take a look at the daily SPDR S&P 500 (NYSE:SPY) chart and reversal type price action forming this week.
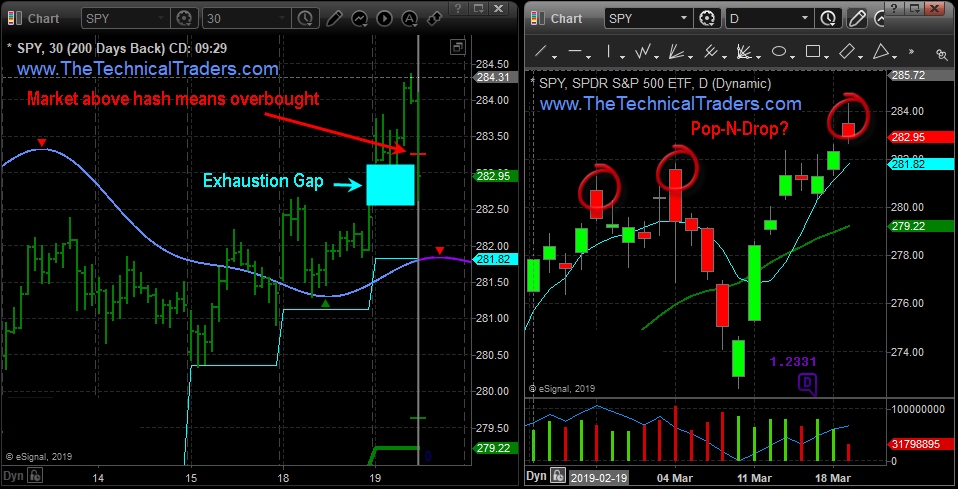
SPY Chart

If you have not protected your long trades well enough or you have recently deployed a bunch of capital into the markets, we strongly suggest you develop a “Plan B” as we are likely to see a 5~10% correction before this downside swing is over.

Latest comments

Loading next article…
Risk Disclosure: Trading in financial instruments and/or cryptocurrencies involves high risks including the risk of losing some, or all, of your investment amount, and may not be suitable for all investors. Prices of cryptocurrencies are extremely volatile and may be affected by external factors such as financial, regulatory or political events. Trading on margin increases the financial risks.
Before deciding to trade in financial instrument or cryptocurrencies you should be fully informed of the risks and costs associated with trading the financial markets, carefully consider your investment objectives, level of experience, and risk appetite, and seek professional advice where needed.
Fusion Media would like to remind you that the data contained in this website is not necessarily real-time nor accurate. The data and prices on the website are not necessarily provided by any market or exchange, but may be provided by market makers, and so prices may not be accurate and may differ from the actual price at any given market, meaning prices are indicative and not appropriate for trading purposes. Fusion Media and any provider of the data contained in this website will not accept liability for any loss or damage as a result of your trading, or your reliance on the information contained within this website.
It is prohibited to use, store, reproduce, display, modify, transmit or distribute the data contained in this website without the explicit prior written permission of Fusion Media and/or the data provider. All intellectual property rights are reserved by the providers and/or the exchange providing the data contained in this website.
Fusion Media may be compensated by the advertisers that appear on the website, based on your interaction with the advertisements or advertisers.
© 2007-2024 - Fusion Media Limited. All Rights Reserved.