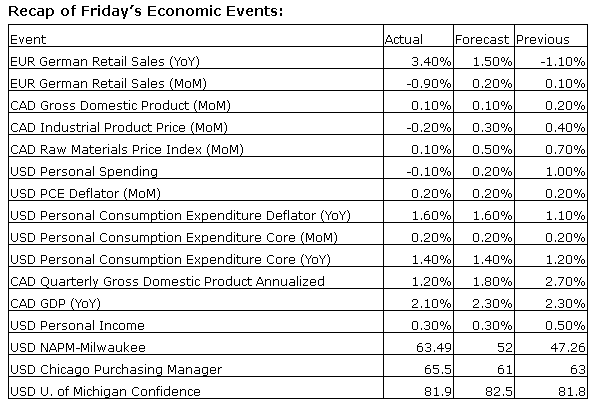
Upcoming US Events for Today:- PMI Manufacturing Index for May will be released at 9:45am. The market expects 56.2 versus 55.4 previous.
- ISM Manufacturing Index for May will be released at 10:00am. The market expects 55.5 versus 54.9 previous.
- Construction Spending for April will be released at 10:00am. The market expects a month-over-month increase of 0.7% versus an increase of 0.2% previous.
Upcoming International Events for Today:
- India Manufacturing PMI for May will be released at 1:00am EST. The market expects 51.4 versus 51.3 previous.
- German Manufacturing PMI for May will be released at 3:55am EST. The market expects 52.9 versus 54.1 previous.
- Euro-Zone Manufacturing PMI for May will be released at 4:00am EST. The market expects 52.5 versus 53.4 previous.
- Great Britain Manufacturing PMI for May will be released at 4:30am EST. The market expects 57.0 versus 57.3 previous.
- HSBC China Manufacturing PMI for May will be released at 9:45p EST. The market expects 49.7, consistent with the previous report.
The Markets
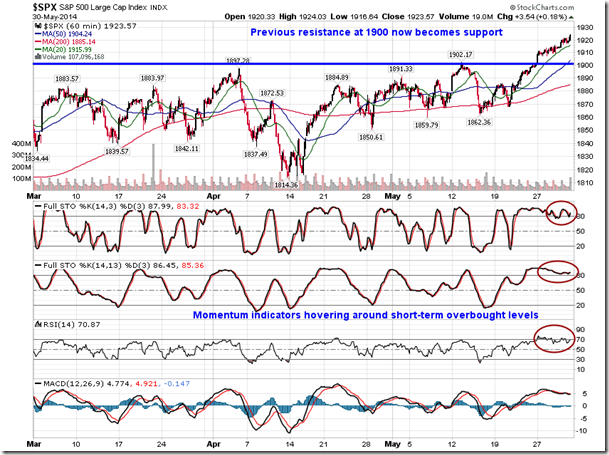
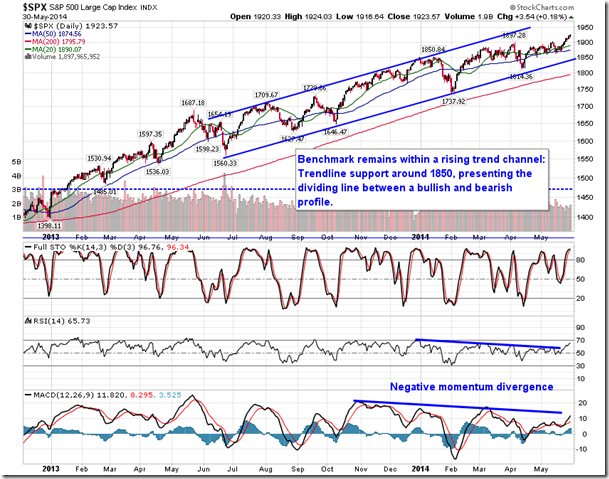
Stocks gained on Friday, pushing the S&P 500 and Dow Jones Industrial Average to new all-time closing highs. Defensive sectors of Consumer Staples, Utilities, and Health Care led the gains on the session, suggesting that investors may be starting to become risk averse after the recent surge to new all-time highs. Looking at the hourly chart of the S&P 500, the market is short-term overbought, increasing the likelihood of a near-term pullback. The recent breakout above resistance at 1900 now becomes support.
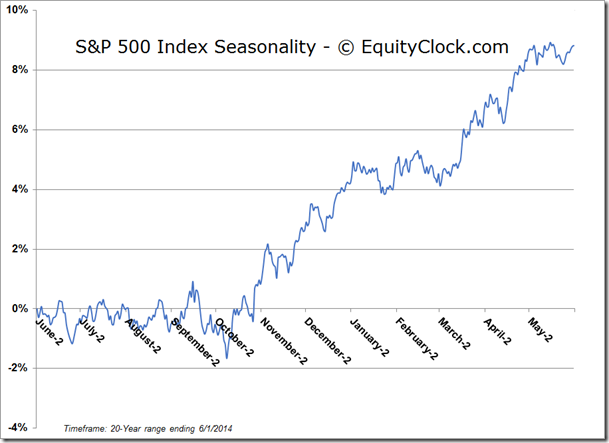
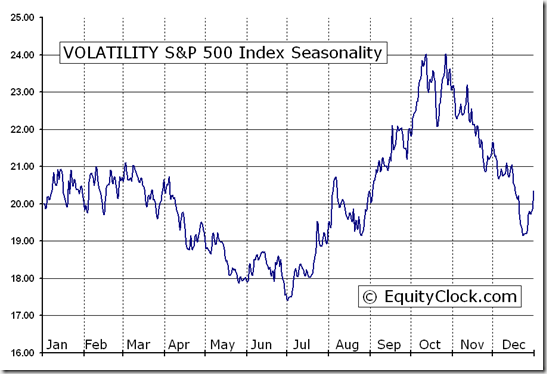
With a new month upon us, it is worthwhile to look at the stock market tendencies for this sixth month of the year. Over the last 20 years, the S&P 500 Index has averaged a loss of 0.3%, however, the benchmark has recorded loss only 40% of the time during the month of June. The most negative time of the month surrounds the quarterly options an futures expiration date, otherwise known as quadruple witching day, which occurs on June 20th. Health Care and Technology were the only two sectors to average gains for the month, while Materials, Consumer Discretionary, and Financials were the weakest segments of the market, each averaging losses of more than 1%. The month leads into what could be classified as the summer rally period, which spans from the last few days of the month through to the first couple of weeks of July. Over the three week period that is runs from June 26th to July 17th, the S&P 500 has averaged gain of 1.48% with opportunities arising in REIT, energy, and gold mining stocks. The month of June is also the average seasonal low for volatility; volatility seasonally rises between July and October.
S&P 500 Index Monthly Averages:

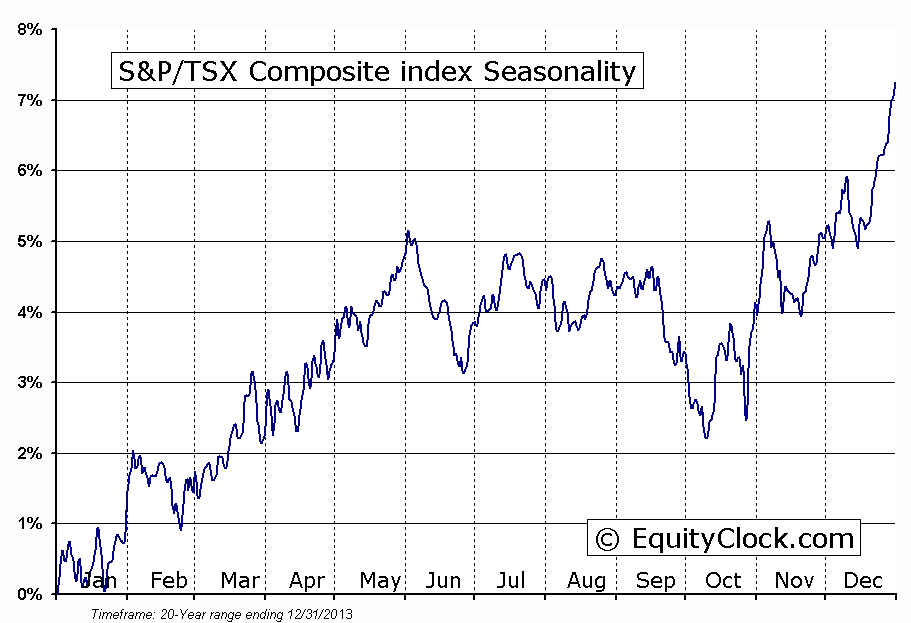
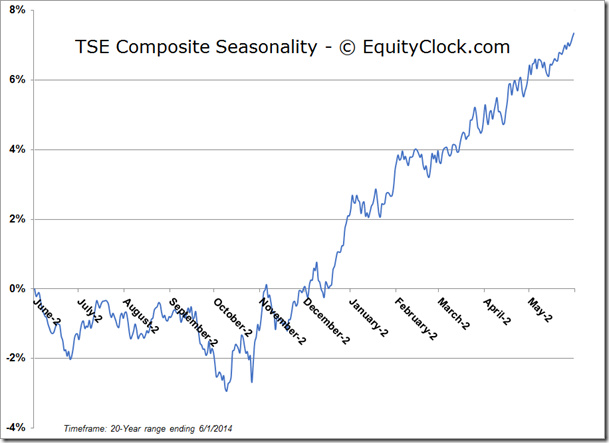
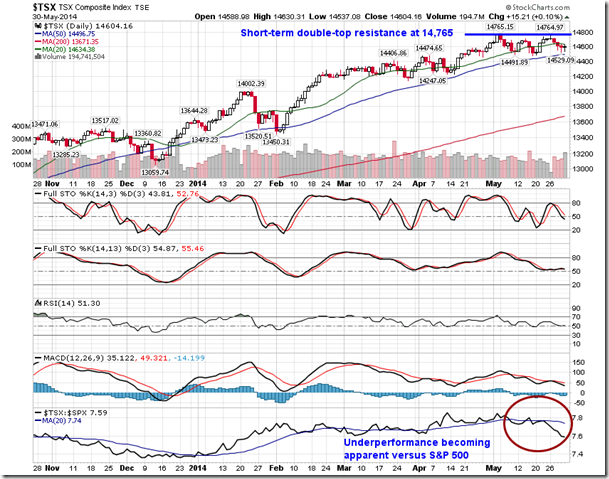
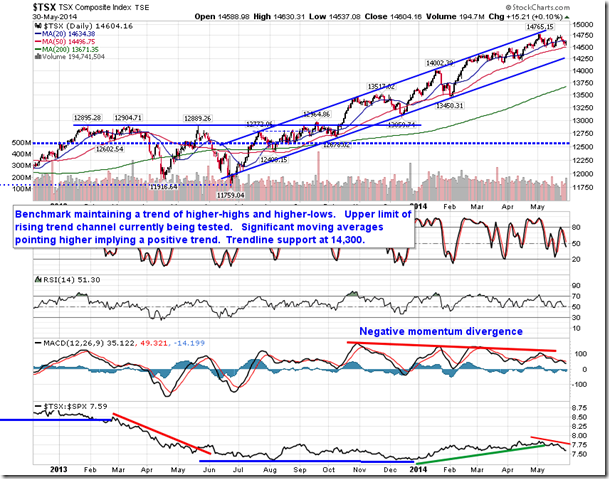
With Material and Financial stocks accounting for the weakest segments of the equity market during the month of June, it should be no surprise that the average peak to the TSX Composite is the start of June (materials and financials are two of the three largest components of the Canadian benchmark). Between June 2nd and October 10th, the TSX Composite has averaged a loss of 2.26%, underperforming American benchmarks over the period. The benchmark concludes its seasonal slide as the period of seasonal strength for materials and financials begins in October. The Canadian benchmark has already started go show underperformance versus the S&P 500, posting losses last week amidst the strong gains for the S&P 500. Short-term double-top resistance has become evident at 14,765.
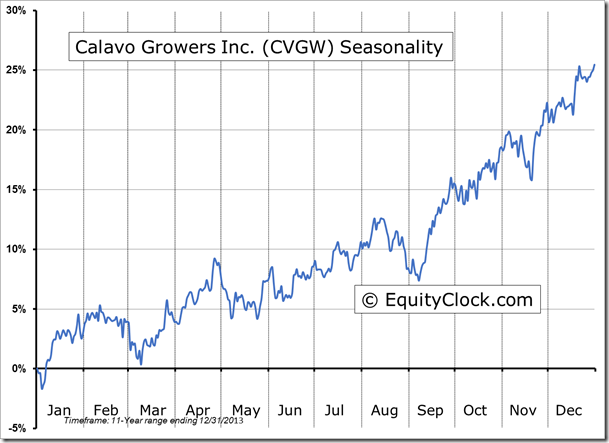
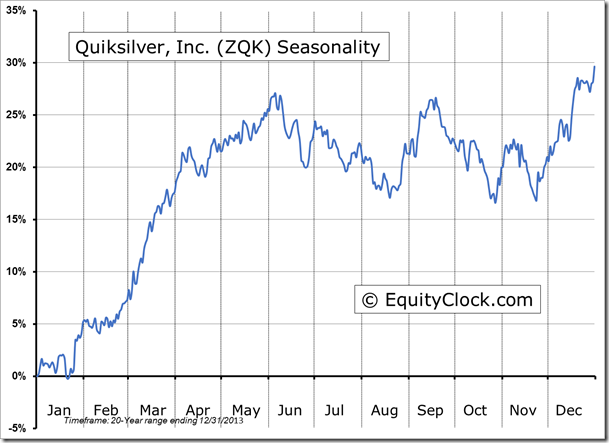
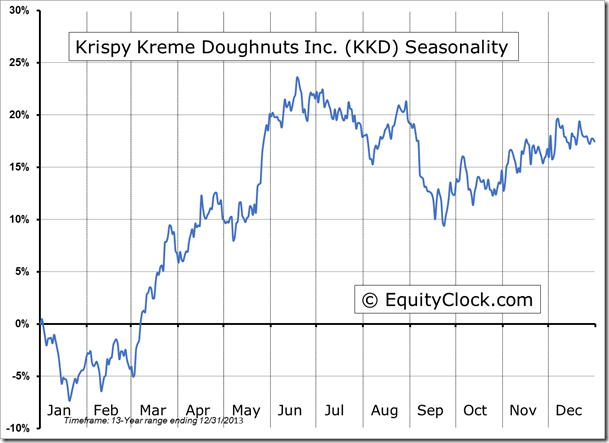
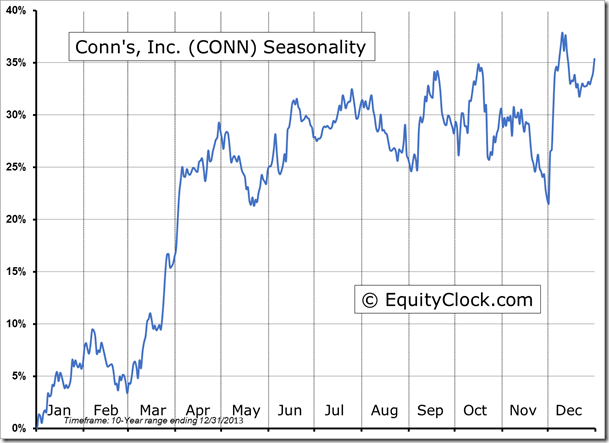
Seasonal charts of companies reporting earnings today:
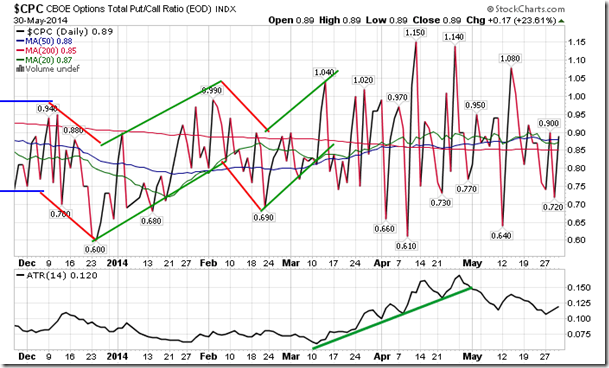
Sentiment on Friday, as gauged by the put-call ratio, ended bullish at 0.89.
S&P 500 Index
TSE Composite
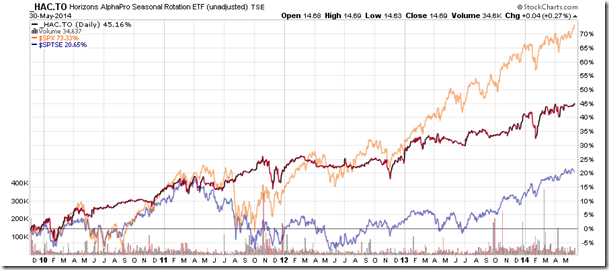
Horizons Seasonal Rotation ETF (TSX:HAC)
- Closing Market Value: $14.69 (up 0.27%)
- Closing NAV/Unit: $14.67 (up 0.16%)
Performance*
| 2014 Year-to-Date | Since Inception (Nov 19, 2009) | |
| HAC.TO | 2.59% | 46.7% |
* performance calculated on Closing NAV/Unit as provided by custodian