The trade on a rangebound United States Oil (N:USO) is now failing (see “The Commodities Crash Accelerates: Scenarios for Trading Oil” for a description). Oil has continued its collapse past the historic 2009 lows and has helped to drive USO to fresh all-time lows.
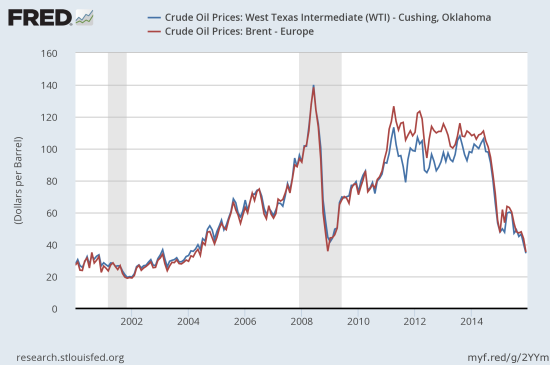
Oil prices continue to collapse.
Source: US. Energy Information Administration, Crude Oil Prices: West Texas Intermediate (WTI) – Cushing, Oklahoma [DCOILWTICO], retrieved from FRED, Federal Reserve Bank of St. Louis, December 24, 2015.
US. Energy Information Administration, Crude Oil Prices: Brent – Europe [DCOILBRENTEU], retrieved from FRED, Federal Reserve Bank of St. Louis, December 24, 2015.
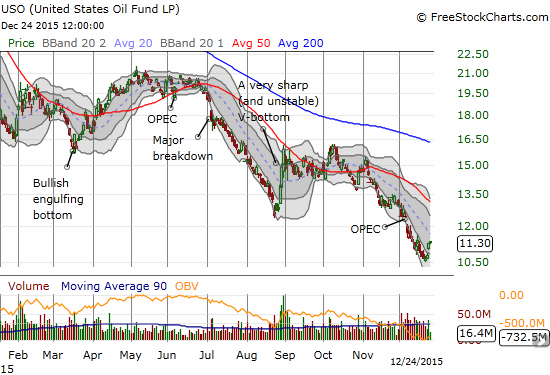
The United States Oil ETF (USO) bounced this week off all-time lows.
Source: FreeStockCharts.com
Looking at the chart of oil makes me realize why some oil bears are growling about oil’s potential to hit $20. Such a plunge would mark a complete reversal of the bull run that launched after the recession of the early 2000s ended and was confirmed when the U.S. attacked Iraq in 2003 under the cover of a search for weapons of mass destruction (WMDs). It is even possible to think of oil as a bursting bubble where profits were artificially manufactured and inflated first by the OPEC cartel, next by financial speculation, and finally by over-leveraged speculators in the form of frackers and wildcatters who thought they could rely on Saudi cooperation and capitulation to their production. The importance of oil as a sign of economic strength is so ingrained that even as consumers enjoy rock-bottom prices for gasoline, financial markets lament how much harder it has become to make money from selling oil. The irony of course is that the S&P 500 (N:SPY) is still trading near all-time highs, so oil’s plunge has not (yet?) truly hurt the stock market in aggregate.
For retail investors and traders, USO is one of the only ways to trade directly on the price of oil. The method of rolling futures means that trading USO is most effective as a bet on short-term price changes. Another viable approach involves selling options on USO. The trade on a rangebound USO relies on selling options. With the current failure in the trade, I made changes this week while implied volatility in USO remains elevated (meaning options on USO, especailly puts, also carry a heavier than usual premium).
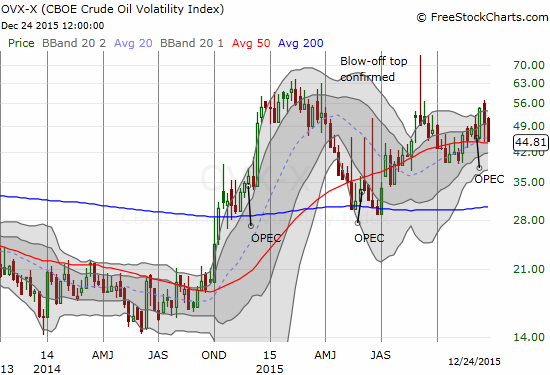
The CBOE Crude Oil Volatility Index remains very elevated., but a top seems to be in place. (weekly chart)
Source: FreeStockCharts.com
This elevated volatility makes sense if fear remains that oil could indeed fall to $20. Even with OPEC refusing once again to help manipulate prices higher, such a move seems, to me, to require a global recession. Of course, with the Federal Reserve now hiking rates, the odds of a recession has to increase some non-zero amount. Yet, the Fed itself expects oil to soon stop its decline and thus its disinflationary pressure. The rate hikes only make sense in a world in which prices stop coming down.
So, assuming volatility is at a peak and the odds of oil falling a lot further are low, I decided to effectively double-down on the USO bet. Note that this approach to trading on a bottom greatly differs from the one I described in “Anatomy of A Bottom: Do Not Argue With Sellers – Celebrate With Buyers.” Here are the steps I took and why:
- Closed out my short on USO Jan 2017 $19 call options. These options will likely never regain substantial value, but I wanted to grab these profits to make way for my new positioning.
- Sold short USO Jan 2018 $10 put options for $1.69/each. My BIG assumption here is that two years should be plenty of time for oil to experience a strong enough rally to lift USO far above current levels and render these put options near worthless during that run. Absent a rally, I am next relying on USO’s prior history of going nowhere from 2009 to 2014 as a blueprint for the future. I'm taking on the risk that USO falls below $8.30 at the end of this two-year period, 26% below current levels. Oil at $20 is about a 45% drop from current levels. Gulp.
- Sold short USO Jan 2017 $15 call options for $0.75/each. These call options replace the position I closed out. I am honestly astounded by the “cheap” price. The pricing says a lot about the market’s very low confidence in a rally in USO, or oil, anytime soon. OPEC’s refusal to cooperate on upward price manipulation has converted the “lower for longer” thesis into what seems like a consensus view. I picked $15 given the $15 to $16 level served as stiff resistance for USO’s last rally. I suspect it will hold on the next rally – whenever that unfolds.
- I KEPT my original short on Jan 2017 $15 put options – the current loss-bearing part of my trade. These put options have doubled in value since I sold them short. They are now trading with almost no premium. This position also justified my new short of the call options. A rally in USO would erase more losses on the puts than they would add losses on the short options for quite some amount of USO upside.
- I also kept my token long Jan 2017 $30 call options which just serve as a cap on losses if some major outlier event happens to the upside. These call options are worthless right now.
So my absolutely ideal scenario would be a rally of USO back to $15 at some point in the next year. Even better if it takes exactly 12 to 13 months to do so.
In the meantime, I am actively trading other oil-related names. For example, Direxion Daily Energy Bear 3X ETF (N:ERY) is setting up for a potentially interesting and profitable test of converged 50 and 200-day moving average (DMAs). I am targeting early January for such a trade given this is the time of year where beaten up stocks typically get a reprieve as part of the Santa Claus rally.
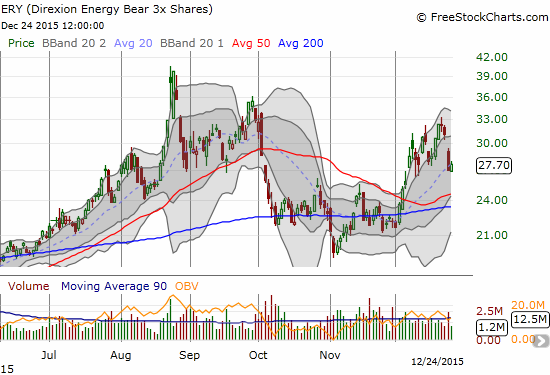
The upward push for Direxion Daily Energy Bear 3X ETF (ERY) has ended for now. It could soar again after bottom-fishing in oil-related names likely ends sometime in early January.
Source: FreeStockCharts.com
Speaking of beaten up stocks, the oil-related Master Limited Partnerships (MLP) have seen a bout of sudden interest. Memorial Production Partners LP (O:MEMP) has almost doubled in three days off its all-time low.
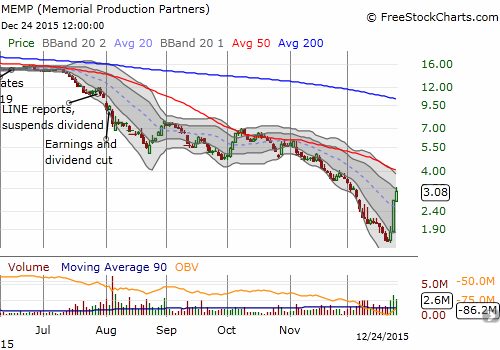
Memorial Production Partners LP (MEMP) shows a rare burst of new life.
Source: FreeStockCharts.com
Even besieged Linn Energy, LLC (O:LINE) has seen some buying interest.
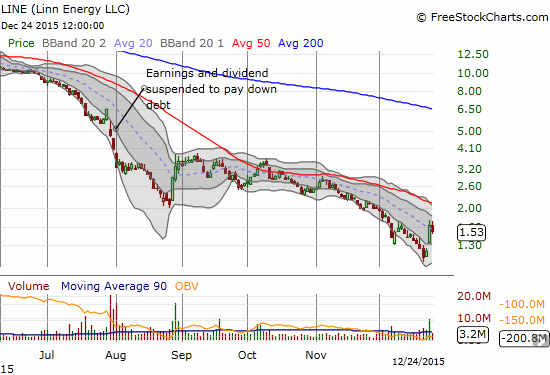
Linn Energy, LLC (LINE) tries to awaken again.
MEMP and LINE have met the minimum bottom-fishing criteria of a strong showing of buying interest: buying volume has surged above average trading volume. The sustainability of these moves is far from confirmed – these kinds of stocks need to break through important resistance or end an important downtrend first. Their 50DMAs loom overhead as that critical test. MEMP has zipped through its declining 20DMA. LINE has met initial resistance at its declining 20DMA.
Be careful out there!
Full disclosure: long and short call and put options in USO, long MEMP, long LINE call options
