Shrinking footfall at malls amid shift of consumers toward online channels, store closures and bankruptcy of retailers emerged as a pressing concern for majority of the retail REITs. But not all are equally facing the brunt, and some have managed to book gains even in this environment, thanks to the business models.
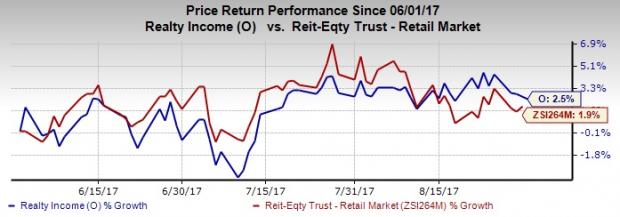
On such stock is Realty Income Corporation (NYSE:O) , shares of which have outperformed the industry in the past three months, gaining 2.5% against 1.9% increase of that of its industry.
The company’s portfolio is well diversified with respect to tenant, industry, geography and property type. Its properties are located in 49 states and Puerto Rico. Further, tenants operate in 47 different industries. In addition, besides retail properties, the company’s portfolio comprises industrial, office, as well as agricultural properties. This diversification helps mitigate risks associated with a particular industry, geography or asset type.
Importantly, this freestanding retail REIT derives more than 90% of its annualized retail rental revenue from tenants with a service, non-discretionary, and/or low price point component to their business. Such businesses are less susceptible to economic recessions, as well as competition from Internet retailing. Moreover, the company targets industrial properties leased to Fortune 1000, mainly investment grade rated companies. These efforts boost the stability of the rental revenue generated from the properties.
Also, the company’s solid underlying real estate quality and prudent underwriting at acquisition has helped the company maintain high occupancy levels consistently. In fact, since 1996, the company’s occupancy level has never been below 96%. In 2017 too, the company projects occupancy to remain at approximately 98%. Additionally, its same store rent growth depicted limited operational volatility.
The company continues to maintain a conservative capital structure. It has modest leverage, robust liquidity, and continued access to attractively priced equity and debt capital. Moreover, it has well-laddered debt maturity schedule.
Also, solid dividend payouts are arguably the biggest enticement for REIT shareholders, and Realty Income remains committed to that. The company enjoys a trademark on the phrase “The Monthly Dividend Company.” To date the company has hiked its dividend 92 times since its public listing in 1994 and declared 566 consecutive common stock monthly dividends in its 48-year operating history.
However, despite Realty Income’s effort to diversify the tenant base, its tenants in the drug store industry accounted for around 11.0% of its rental revenue in second-quarter 2017. This makes the company’s results susceptible to any adverse changes in this industry.
Further, the company has a substantial exposure to single tenant assets. In fact, of the company’s 5,028 properties in the portfolio, as of Jun 30, 2017, 5,000, or 99.4%, are single-tenant properties and the rest are multi-tenant assets. However, single-tenant leases involve specific and significant risks associated with tenant default. Thus, in case of financial failure of, or default in payment by, a single tenant, the company’s rental revenue from that property as well as the value of the property suffers significantly.
Realty Income currently has a Zacks Rank #3 (Hold).
Stocks to Consider
Better-ranked stocks in the real estate space include American Assets Trust, Inc. (NYSE:AAT) , Communications Sales & Leasing, Inc. (NASDAQ:UNIT) and InfraREIT Inc. (NYSE:HIFR) , each carrying a Zacks Rank #2 (Buy). You can see the complete list of today’s Zacks #1 Rank (Strong Buy) stocks here.
While American Assets Trust and Communications Sales & Leasing have expected long-term growth rates of 6.1% and 7.5%, respectively, the expected long-term growth rate for InfraREIT is currently pegged at around 8%.
Note: All EPS numbers presented in this write up represent funds from operations (“FFO”) per share. FFO, a widely used metric to gauge the performance of REITs, is obtained after adding depreciation and amortization and other non-cash expenses to net income.
One Simple Trading Idea
Since 1988, the Zacks system has more than doubled the S&P 500 with an average gain of +25% per year. With compounding, rebalancing, and exclusive of fees, it can turn thousands into millions of dollars.
This proven stock-picking system is grounded on a single big idea that can be fortune shaping and life changing. You can apply it to your portfolio starting today.
Learn more >>
American Assets Trust, Inc. (AAT): Free Stock Analysis Report
Realty Income Corporation (O): Free Stock Analysis Report
InfraREIT, Inc. (HIFR): Free Stock Analysis Report
Communications Sales & Leasing,Inc. (UNIT): Free Stock Analysis Report
Original post
Zacks Investment Research
