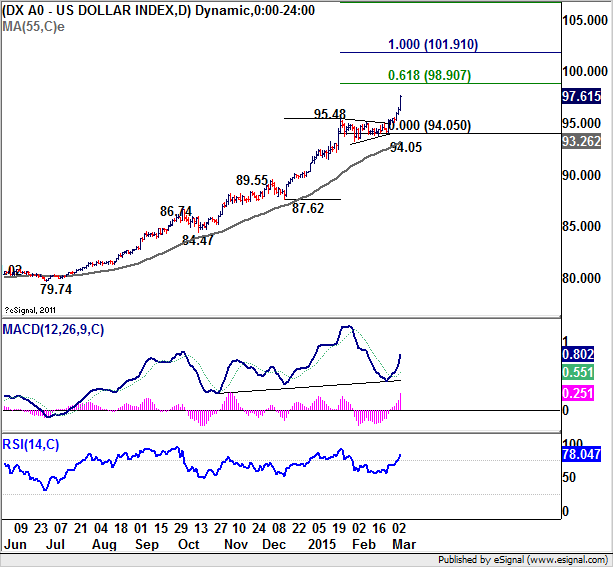
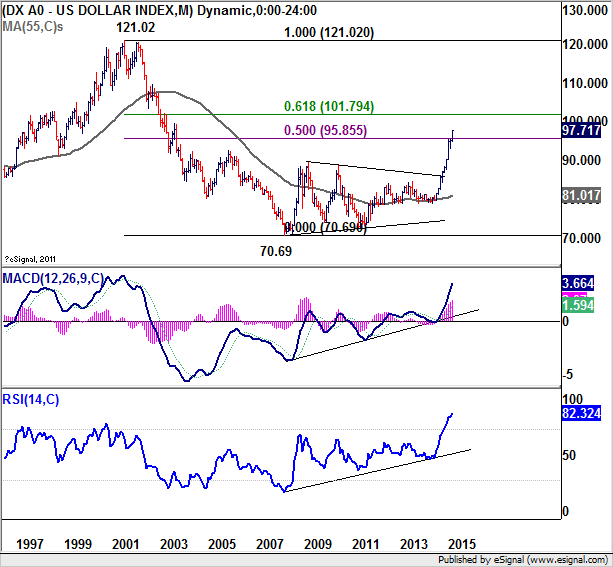
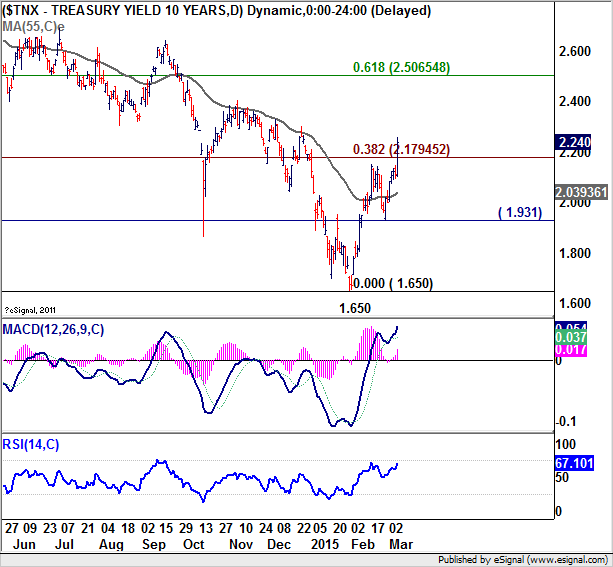
Dollar surged broadly as the solid February employment data solidified the case for Fed to hike interests this summer, possibly in June and by latest September. Some economists noted that Friday's NFP report showed that the job growth showed exceptional strength and Fed couldn't wait longer even if wage growth stays subdued. Such expectation was clearly reflected in the financial markets. Dollar index jumped sharply to close at 97.71 and gained 2.6% over the week. Treasury yields also rose sharply with 10 year yield close at 2.24, up from prior week's 2.00. 30 year yield also rose to 2.84 comparing to prior week's 2.60. Meanwhile, US equities staged a deep pull back. DJIA closed at 17856.78, down from prior week's 18132.70. S&P 500 dropped to 2071.26, down from prior week's 2103.00. Gold also lost -2.34% on Friday on dollar strength.
Let's have a more detailed look at the technical pictures. Dollar index rose to as high as 97.72 before closing strongly at 97.71. Next near term target is 61.8% projection of 87.62 to 95.48 from 94.05 at 98.90. In the bigger picture, 50% retracement of 121.02 to 70.69 at 95.85 was firmly taken out. The current up trend should now target 61.8% retracement at 101.79 next. Even though the index is clear in overbought situation, there is no sign of loss of momentum yet. Outlook will stay bullish as long as 94.05 support holds, even in case of retreat.
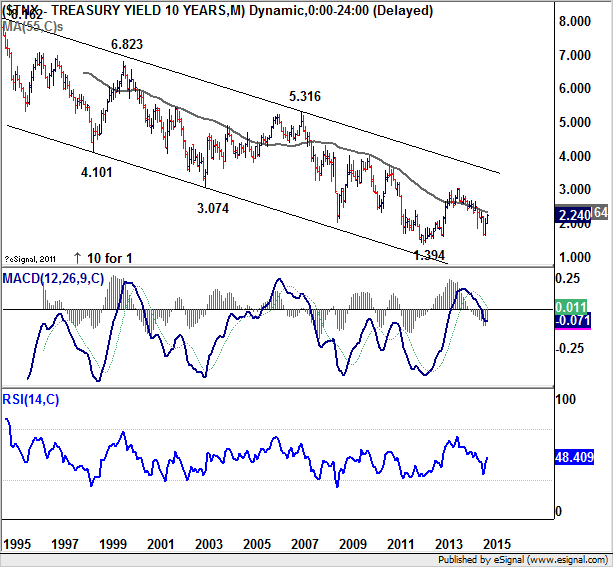
10 year yield's strong break of 38.2% retracement of 3.036 to 1.650 at 2.179 argues that the near term trend has reversed. Also, this is supported by sustained trading above 55 days EMA. We'd now expect further rise to 61.8% retracement at 2.51. At this point, we'd be cautious on topping above there. In the bigger picture, TNX is still staying well inside a multi-year falling channel. Also, it's struggling to stay above 55 months EMA so far. Hence, we'll remain cautious that the current rebound could be a non-sustainable one. Break of 1.931 support will turn focus back to 1.650 instead.
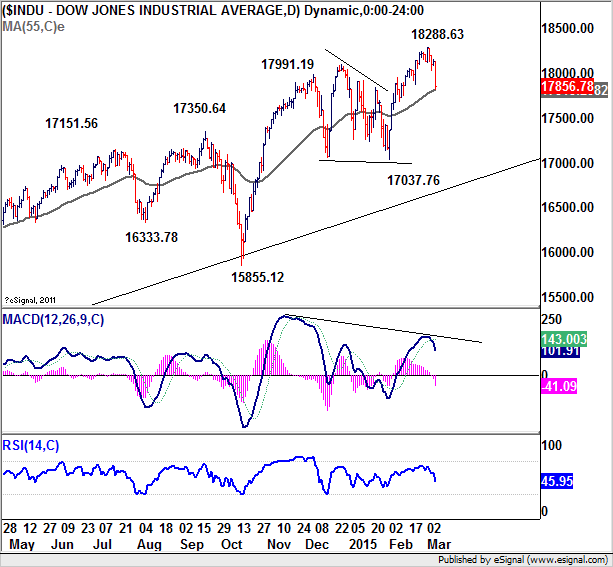
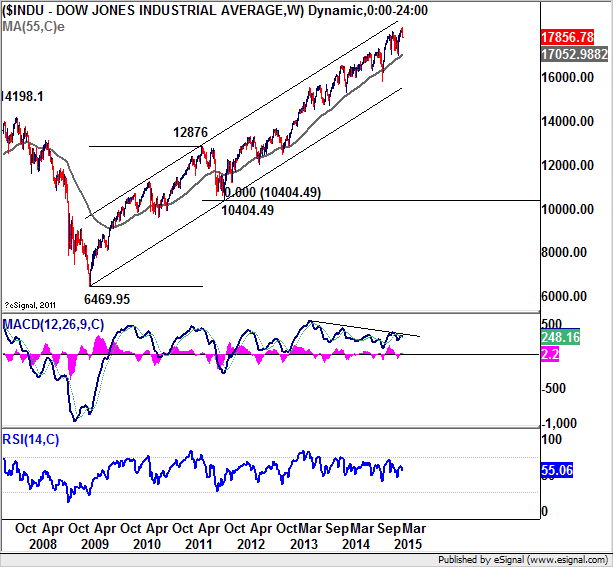
DJIA dropped sharply last week and is back pressing 55 days EMA. While there is no clear sign of trend reversal yet, there are two points to note. Firstly, bearish divergence condition is seen in daily MACD. Secondly the rise from 17037.76 could be a terminal thrust following a triangle pattern. Initial focus is now on 55 days EMA (now at 17815.28). Sustained break will raise the chance of medium term topping and would turn focus to 17037.76 key near term support. Nonetheless, rebound from the current level will maintain bullishness for another high above 18288.63. In the bigger picture, DJIA stays well inside multi-year rising channel, as well as 55 weeks EMA. Bearish divergence condition is seen in weekly MACD. Break of 17037.76 would also take out the 55 week EMA and bring deeper medium term correction. But there is no confirmed sign of long term reversal yet.
In the currency markets, while the greenback was the strongest last week, Euro and Swiss Franc were the weakest. Fresh selloff was seen after ECB meeting (more regarding ECB in ECB Unveiled Details Of Additional QE, Raised Growth Outlook). Our strategy of EUR/USD short was correct. Meanwhile, we also entered short in AUD/USD on break of 0.7739 minor support. USD/CAD long was not entered yet.
Dollar long will remain the main theme this week. Euro's weakness against Sterling, Aussie and Canadian (also again yen), suggests that the common currency will remain the weakest one. Nonetheless, commodity currencies would likely follow. Judging from the price actions in AUD/CAD, as it could gyrate further in range in short to medium term, the relative strength between Aussie and Canadian could flip-flop for a while. Hence, firstly, we'll stay short with EUR/USD, and lower, but loosen up the stop to 1.1100 to let the down trend run. We'll stay short in AUD/USD but with a tighter stop at 0.7850. Meanwhile, we'll maintain the strategy to buy USD/CAD on break of 1.2662 so as to hedge against the change in relative strength between Aussie and Canadian.
